Given the sample mean, frequency and probability. Find the number 4 and 5 in the second picture.
Given the sample mean, frequency and probability. Find the number 4 and 5 in the second picture.

A First Course in Probability (10th Edition)
10th Edition
ISBN:9780134753119
Author:Sheldon Ross
Publisher:Sheldon Ross
Chapter1: Combinatorial Analysis
Section: Chapter Questions
Problem 1.1P: a. How many different 7-place license plates are possible if the first 2 places are for letters and...

Related questions

Question
Given the sample mean , frequency and probability. Find the number 4 and 5 in the second picture.
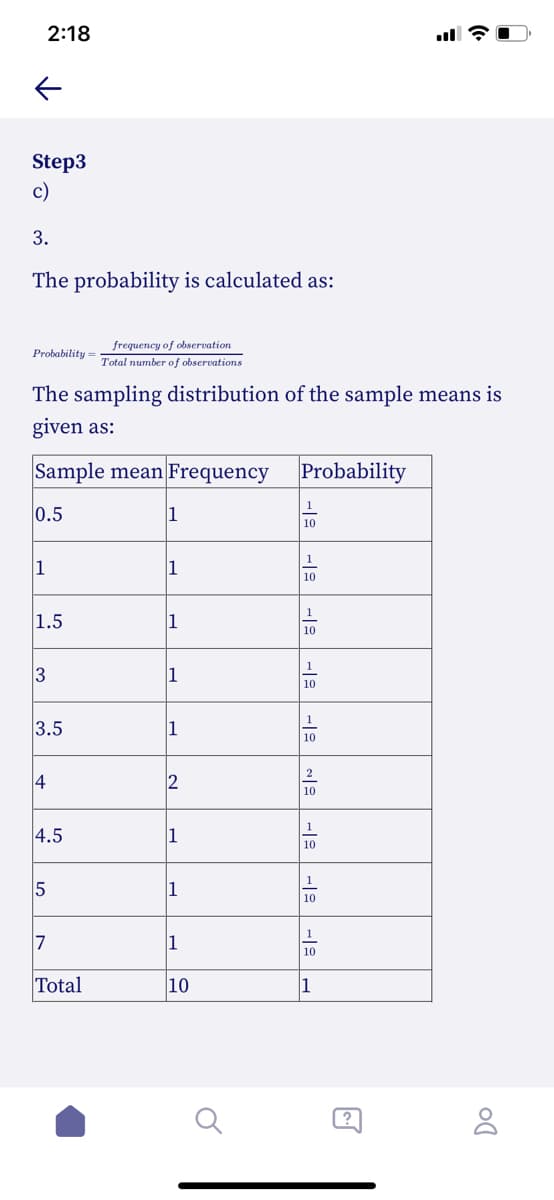
Transcribed Image Text:2:18
Step3
c)
3.
The probability is calculated as:
frequency of observation
Probability
Total number of observations
The sampling distribution of the sample means is
given as:
Sample mean Frequency
Probability
1
0.5
1
10
1
1
1
10
1
1.5
1
10
1
1
10
1
3.5
10
2
4
2
10
1
4.5
1
10
1
1
10
1
7
1
10
Total
10
1
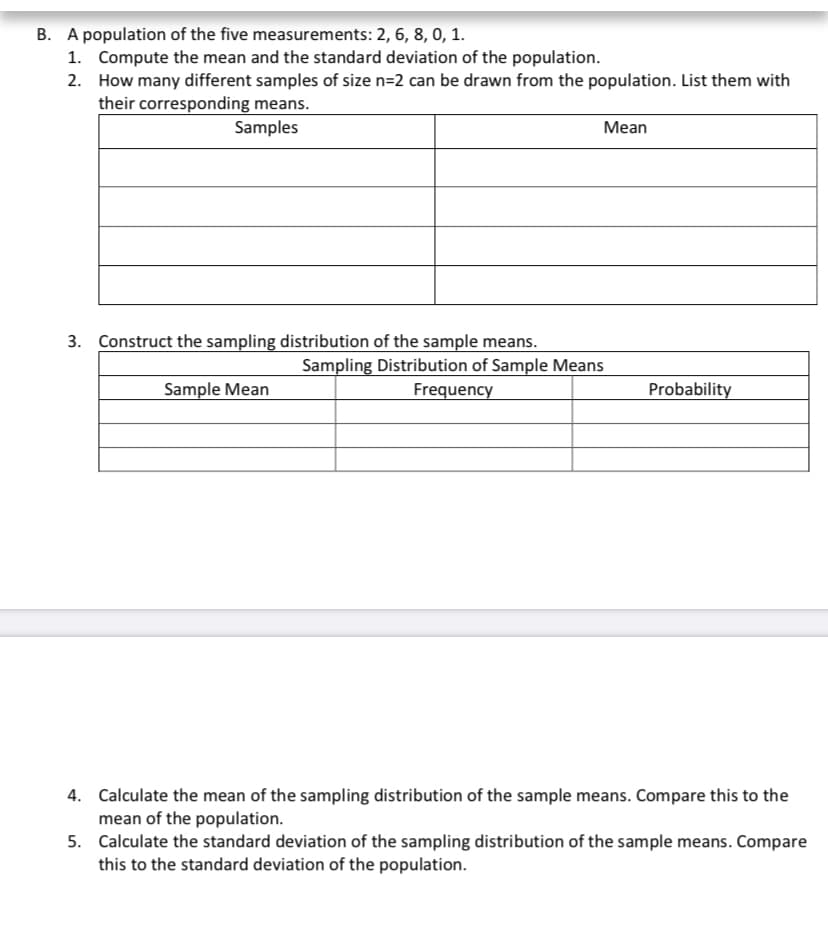
Transcribed Image Text:B. A population of the five measurements: 2, 6, 8, 0, 1.
1. Compute the mean and the standard deviation of the population.
2. How many different samples of size n=2 can be drawn from the population. List them with
their corresponding means.
Samples
Mean
3. Construct the sampling distribution of the sample means.
Sampling Distribution of Sample Means
Sample Mean
Frequency
Probability
4. Calculate the mean of the sampling distribution of the sample means. Compare this to the
mean of the population.
5. Calculate the standard deviation of the sampling distribution of the sample means. Compare
this to the standard deviation of the population.
Expert Solution
This question has been solved!
Explore an expertly crafted, step-by-step solution for a thorough understanding of key concepts.

This is a popular solution!

Trending now
This is a popular solution!

Step by step
Solved in 2 steps

Knowledge Booster


Learn more about
Need a deep-dive on the concept behind this application? Look no further. Learn more about this topic, probability and related others by exploring similar questions and additional content below.Recommended textbooks for you
A First Course in Probability (10th Edition)
Probability
ISBN:
9780134753119
Author:
Sheldon Ross
Publisher:
PEARSON

A First Course in Probability (10th Edition)
Probability
ISBN:
9780134753119
Author:
Sheldon Ross
Publisher:
PEARSON