Given there are two assets making up a portfolio where each asset has the following characteristics: Asset Expected return 10% Risk (standard deviation) 1 4% 2 16% 11% The correlation between the two assets is -1. (a) Given that the proportion invested in each asset is 50%, compute the expected return of the portfolio. (b) Given that the proportion invested in each asset is 50%, compute the portfolio risk, i.e. standard deviation of the portfolio. (c) Without using a graph paper, scratch a diagram to illustrate the portfolio diversification. Show the portfolio risk for perfect positive correlation and perfect negative correlation.
Given there are two assets making up a portfolio where each asset has the following characteristics: Asset Expected return 10% Risk (standard deviation) 1 4% 2 16% 11% The correlation between the two assets is -1. (a) Given that the proportion invested in each asset is 50%, compute the expected return of the portfolio. (b) Given that the proportion invested in each asset is 50%, compute the portfolio risk, i.e. standard deviation of the portfolio. (c) Without using a graph paper, scratch a diagram to illustrate the portfolio diversification. Show the portfolio risk for perfect positive correlation and perfect negative correlation.

Chapter8: Analysis Of Risk And Return
Section: Chapter Questions
Problem 25P

Related questions

Concept explainers
Risk and return
Before understanding the concept of Risk and Return in Financial Management, understanding the two-concept Risk and return individually is necessary.
Capital Asset Pricing Model
Capital asset pricing model, also known as CAPM, shows the relationship between the expected return of the investment and the market at risk. This concept is basically used particularly in the case of stocks or shares. It is also used across finance for pricing assets that have higher risk identity and for evaluating the expected returns for the assets given the risk of those assets and also the cost of capital.
Question
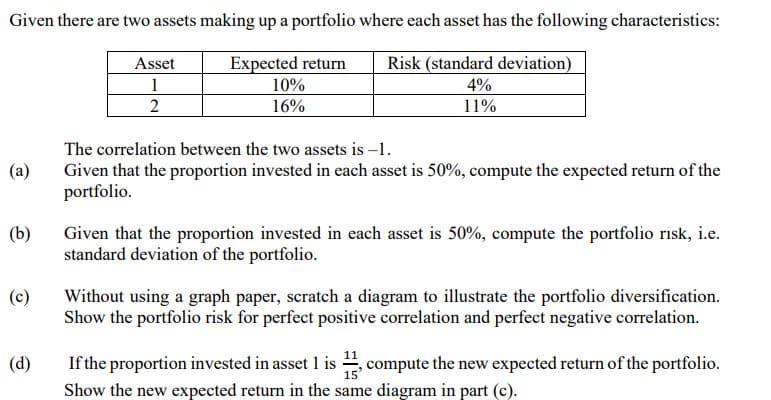
Transcribed Image Text:Given there are two assets making up a portfolio where each asset has the following characteristics:
Asset
Risk (standard deviation)
Expected return
10%
1
4%
2
16%
11%
The correlation between the two assets is -1.
(a)
Given that the proportion invested in each asset is 50%, compute the expected return of the
portfolio.
(b)
Given that the proportion invested in each asset is 50%, compute the portfolio risk, i.e.
standard deviation of the portfolio.
(c)
Without using a graph paper, scratch a diagram to illustrate the portfolio diversification.
Show the portfolio risk for perfect positive correlation and perfect negative correlation.
(d)
If the proportion invested in asset 1 is , compute the new expected return of the portfolio.
Show the new expected return in the same diagram in part (c).
Expert Solution
This question has been solved!
Explore an expertly crafted, step-by-step solution for a thorough understanding of key concepts.

Step by step
Solved in 2 steps with 4 images

Knowledge Booster


Learn more about
Need a deep-dive on the concept behind this application? Look no further. Learn more about this topic, finance and related others by exploring similar questions and additional content below.Recommended textbooks for you
EBK CONTEMPORARY FINANCIAL MANAGEMENT
Finance
ISBN:
9781337514835
Author:
MOYER
Publisher:
CENGAGE LEARNING - CONSIGNMENT


Intermediate Financial Management (MindTap Course…
Finance
ISBN:
9781337395083
Author:
Eugene F. Brigham, Phillip R. Daves
Publisher:
Cengage Learning
EBK CONTEMPORARY FINANCIAL MANAGEMENT
Finance
ISBN:
9781337514835
Author:
MOYER
Publisher:
CENGAGE LEARNING - CONSIGNMENT
Intermediate Financial Management (MindTap Course…
Finance
ISBN:
9781337395083
Author:
Eugene F. Brigham, Phillip R. Daves
Publisher:
Cengage Learning