Golden Corporation's current year income statement, comparative balance sheets, and additional information follow. For the year, (1) all sales are credit sales, (2) all credits to Accounts Receivable reflect cash receipts from customers, (3) all purchases of inventory are on credit, (4) all debits to Accounts Payable reflect cash payments for inventory, and (5) any change in Income Taxes Payable reflects the accrual and cash payment of taxes. Assets Cash Accounts receivable Inventory Total current assets GOLDEN CORPORATION Comparative Balance Sheets December 31 Equipment Accumulated depreciation-Equipment Total assets Liabilities and Equity Accounts payable Income taxes payable Total current liabilities Equity Common stock, $2 par value Paid-in capital in excess of par value, common stock Retained earnings Total liabilities and equity Current Year $ 183,000 111,500 629,500 924,000 386,200 (167,500) $ 1,142,700 $ 125,000 47,000 172,000 614,800 230,200 125,700 $ 1,142,700 Prior Year $ 127,900 90,000 545,000 762,900 318,000 (113,500) $967,400 $ 90,000 34,600 124,600 587,000 188,500 67,300 $ 967,400 Golden Corporation's current year income statement, comparative balance sheets, and additional information follow. For the year, (1) all sales are credit sales, (2) all credits to Accounts Receivable reflect cash receipts from customers, (3) all purchases of inventory are on credit, (4) all debits to Accounts Payable reflect cash payments for inventory, and (5) any change in Income Taxes Payable reflects the accrual and cash payment of taxes. Assets Cash Accounts receivable Inventory Total current assets Equipment Accumulated depreciation-Equipment Total assets Liabilities and Equity Accounts payable Income taxes payable Total current liabilities Equity Common stock, $2 par value Paid-in capital in excess of par value, common stock Retained earnings Total liabilities and equity Show Transcribed Text GOLDEN CORPORATION Comparative Balance Sheets December 31 C Sales Cost of goods sold Gross profit 3 C GOLDEN CORPORATION Income Statement For Current Year Ended December 31 Operating expenses (excluding depreciation) Depreciation expense Income before taxes Income taxes expense Net income Current Year $ 183,000 111,500 629,500 924,000 386,200 (167,500) $1,142,700 Additional Information on Current Year Transactions $ 125,000 47,000 172,000 614,800 230,200 125,700 $ 1,142,700 Prior Year $ 127,900 90,000 545,000 762,900 318,000 (113,500) $ 967,400 a. Purchased equipment for $68,200 cash. b. Issued 13,900 shares of common stock for $5 cash per share. c. Declared and paid $108,000 in cash dividends. $ 90,000 34,600 124,600 587,000 188,500 67,300 $ 967,400 $ 1,887,000 1,105,000 782,000 513,000 54,000 215,000 48,600 $ 166,400 Required: Prepare a complete statement of cash flows using a spreadsheet under the indirect method. Note: Enter all amounts as positive values.
Golden Corporation's current year income statement, comparative balance sheets, and additional information follow. For the year, (1) all sales are credit sales, (2) all credits to Accounts Receivable reflect cash receipts from customers, (3) all purchases of inventory are on credit, (4) all debits to Accounts Payable reflect cash payments for inventory, and (5) any change in Income Taxes Payable reflects the accrual and cash payment of taxes. Assets Cash Accounts receivable Inventory Total current assets GOLDEN CORPORATION Comparative Balance Sheets December 31 Equipment Accumulated depreciation-Equipment Total assets Liabilities and Equity Accounts payable Income taxes payable Total current liabilities Equity Common stock, $2 par value Paid-in capital in excess of par value, common stock Retained earnings Total liabilities and equity Current Year $ 183,000 111,500 629,500 924,000 386,200 (167,500) $ 1,142,700 $ 125,000 47,000 172,000 614,800 230,200 125,700 $ 1,142,700 Prior Year $ 127,900 90,000 545,000 762,900 318,000 (113,500) $967,400 $ 90,000 34,600 124,600 587,000 188,500 67,300 $ 967,400 Golden Corporation's current year income statement, comparative balance sheets, and additional information follow. For the year, (1) all sales are credit sales, (2) all credits to Accounts Receivable reflect cash receipts from customers, (3) all purchases of inventory are on credit, (4) all debits to Accounts Payable reflect cash payments for inventory, and (5) any change in Income Taxes Payable reflects the accrual and cash payment of taxes. Assets Cash Accounts receivable Inventory Total current assets Equipment Accumulated depreciation-Equipment Total assets Liabilities and Equity Accounts payable Income taxes payable Total current liabilities Equity Common stock, $2 par value Paid-in capital in excess of par value, common stock Retained earnings Total liabilities and equity Show Transcribed Text GOLDEN CORPORATION Comparative Balance Sheets December 31 C Sales Cost of goods sold Gross profit 3 C GOLDEN CORPORATION Income Statement For Current Year Ended December 31 Operating expenses (excluding depreciation) Depreciation expense Income before taxes Income taxes expense Net income Current Year $ 183,000 111,500 629,500 924,000 386,200 (167,500) $1,142,700 Additional Information on Current Year Transactions $ 125,000 47,000 172,000 614,800 230,200 125,700 $ 1,142,700 Prior Year $ 127,900 90,000 545,000 762,900 318,000 (113,500) $ 967,400 a. Purchased equipment for $68,200 cash. b. Issued 13,900 shares of common stock for $5 cash per share. c. Declared and paid $108,000 in cash dividends. $ 90,000 34,600 124,600 587,000 188,500 67,300 $ 967,400 $ 1,887,000 1,105,000 782,000 513,000 54,000 215,000 48,600 $ 166,400 Required: Prepare a complete statement of cash flows using a spreadsheet under the indirect method. Note: Enter all amounts as positive values.

Cornerstones of Financial Accounting
4th Edition
ISBN:9781337690881
Author:Jay Rich, Jeff Jones
Publisher:Jay Rich, Jeff Jones
Chapter1: Accounting And The Financial Statements
Section: Chapter Questions
Problem 12MCQ: Which of the following sentences regarding the statement of cash flows is false? The statement of...

Related questions
Question
Please do not give solution in image format ? And Fast Answering Please And Explain Proper Step by Step.
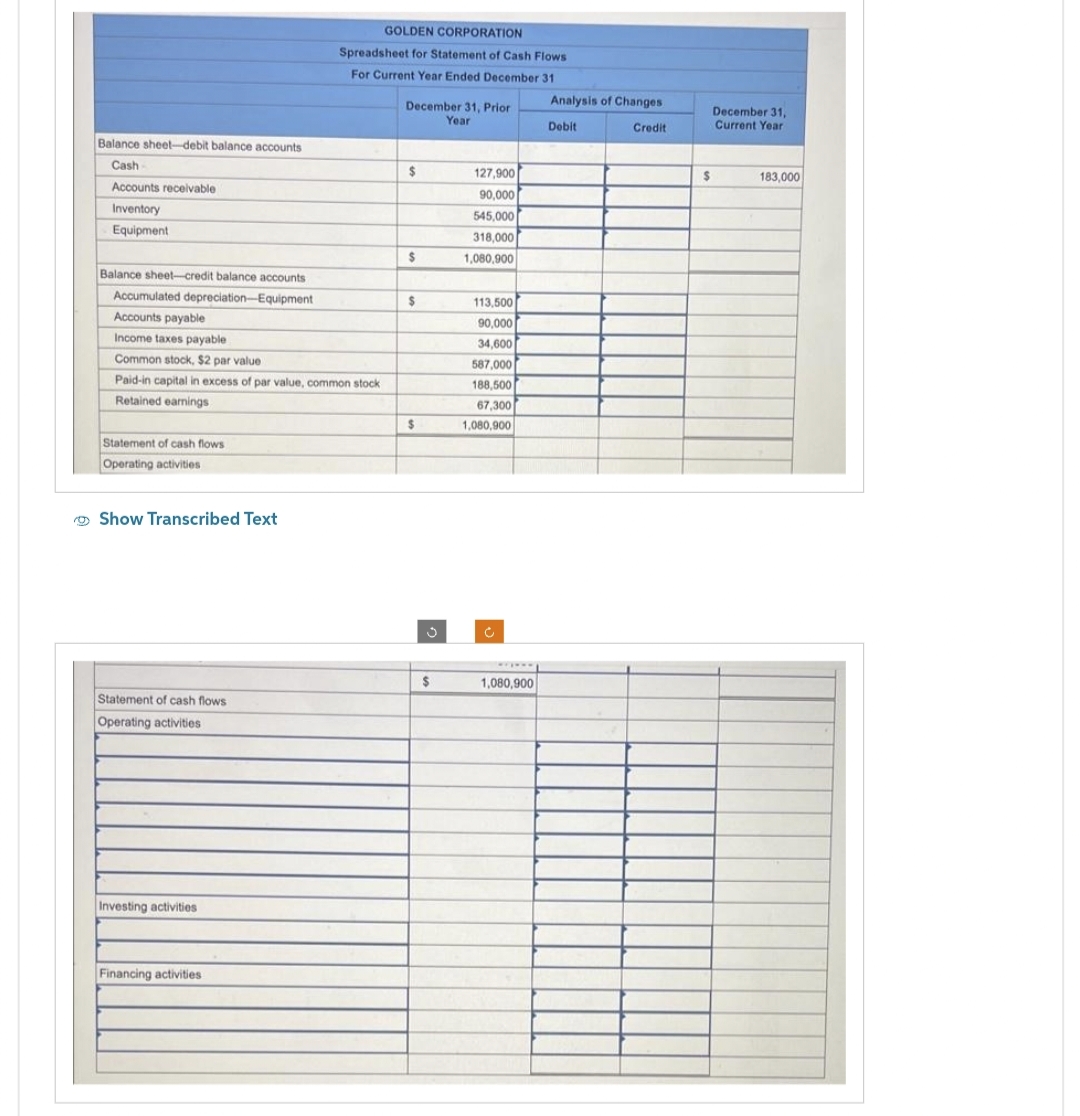
Transcribed Image Text:Balance sheet-debit balance accounts
Cash
Accounts receivable
Inventory
Equipment
Balance sheet-credit balance accounts
Accumulated depreciation-Equipment
Accounts payable
Income taxes payable
Common stock, $2 par value
Paid-in capital in excess of par value, common stock
Retained earnings
Statement of cash flows
Operating activities
Show Transcribed Text
Statement of cash flows
Operating activities
Investing activities
GOLDEN CORPORATION
Spreadsheet for Statement of Cash Flows
For Current Year Ended December 31
Financing activities
December 31, Prior
Year
$
$
$
$
3
$
127,900
90,000
545,000
318,000
1,080,900
113.500
90,000
34,600
587,000
188,500
67,300
1,080,900
Ĉ
wwwwww
1,080,900
Analysis of Changes
Debit
Credit
$
December 31,
Current Year
183,000
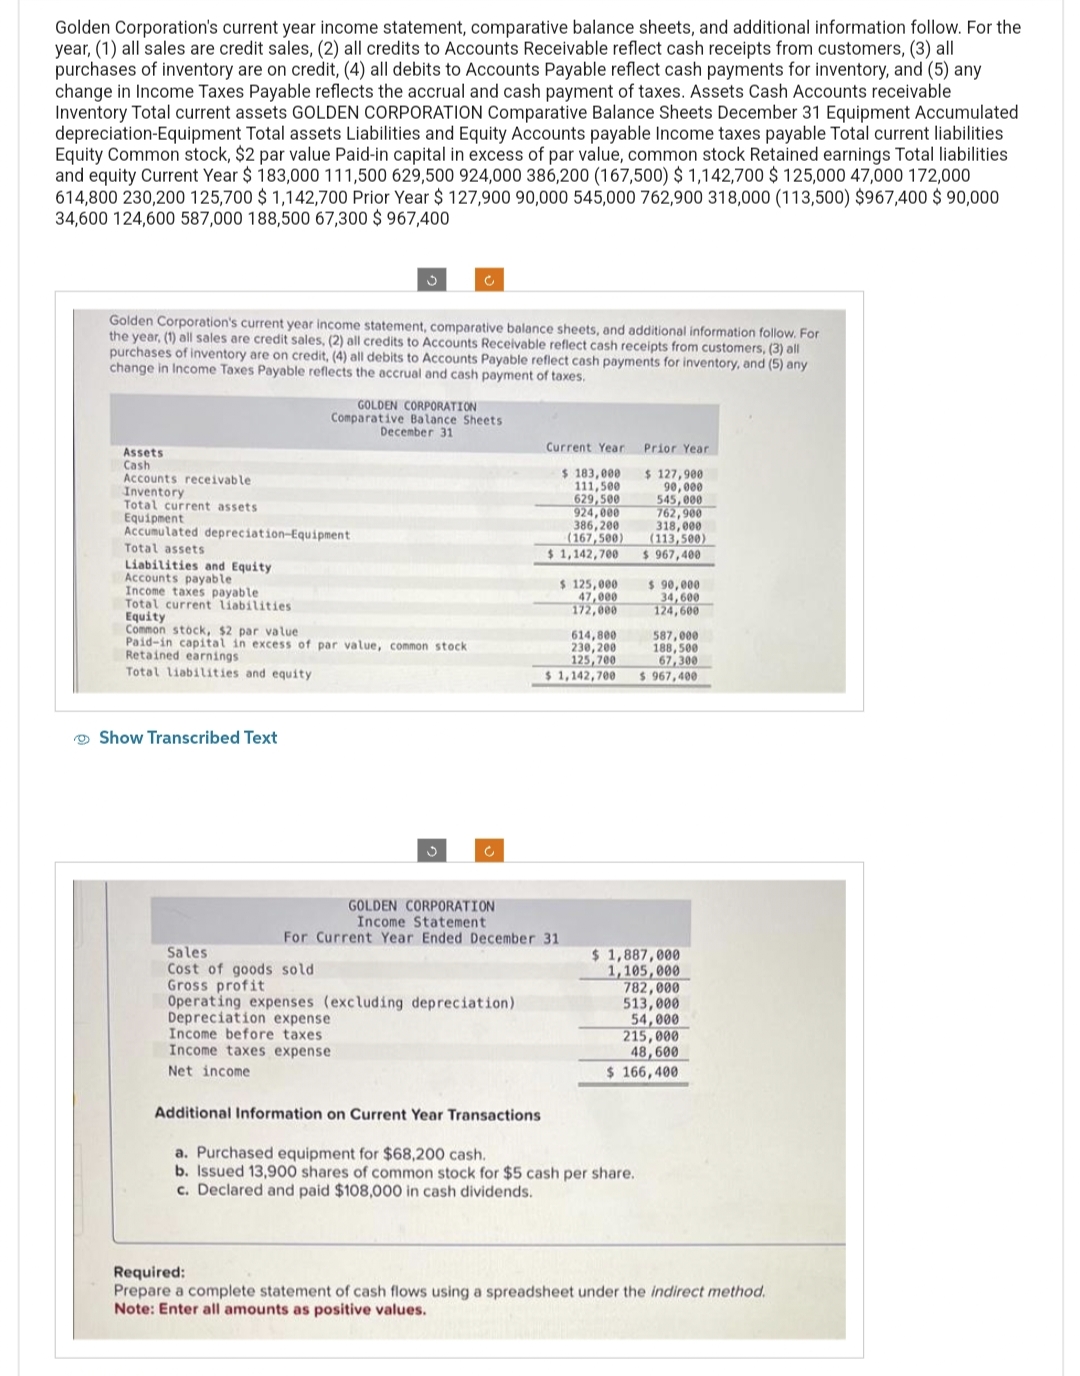
Transcribed Image Text:Golden Corporation's current year income statement, comparative balance sheets, and additional information follow. For the
year, (1) all sales are credit sales, (2) all credits to Accounts Receivable reflect cash receipts from customers, (3) all
purchases of inventory are on credit, (4) all debits to Accounts Payable reflect cash payments for inventory, and (5) any
change in Income Taxes Payable reflects the accrual and cash payment of taxes. Assets Cash Accounts receivable
Inventory Total current assets GOLDEN CORPORATION Comparative Balance Sheets December 31 Equipment Accumulated
depreciation-Equipment Total assets Liabilities and Equity Accounts payable Income taxes payable Total current liabilities
Equity Common stock, $2 par value Paid-in capital in excess of par value, common stock Retained earnings Total liabilities
and equity Current Year $ 183,000 111,500 629,500 924,000 386,200 (167,500) $ 1,142,700 $ 125,000 47,000 172,000
614,800 230,200 125,700 $ 1,142,700 Prior Year $ 127,900 90,000 545,000 762,900 318,000 (113,500) $967,400 $ 90,000
34,600 124,600 587,000 188,500 67,300 $ 967,400
Golden Corporation's current year income statement, comparative balance sheets, and additional information follow. For
the year, (1) all sales are credit sales, (2) all credits to Accounts Receivable reflect cash receipts from customers, (3) all
purchases of inventory are on credit, (4) all debits to Accounts Payable reflect cash payments for inventory, and (5) any
change in Income Taxes Payable reflects the accrual and cash payment of taxes.
Assets
Cash
Accounts receivable.
Inventory
Total current assets
Equipment
Accumulated depreciation-Equipment
Total assets
Liabilities and Equity
Accounts payable
Income taxes payable
Total current liabilities.
GOLDEN CORPORATION
Comparative Balance Sheets
December 31
Equity
Common stock, $2 par value
Paid-in capital in excess of par value, common stock
Retained earnings
Total liabilities and equity
Show Transcribed Text
Sales
Cost of goods sold.
Gross profit
c
Current Year
$ 183,000
111,500
629,500
924,000
386,200
(167,500)
$1,142,700
GOLDEN CORPORATION
Income Statement
For Current Year Ended December 31
Operating expenses (excluding depreciation).
Depreciation expense
Income before taxes
Income taxes expense
Net income
$ 125,000
47,000
172,000
614,800
230, 200
125,700
$1,142,700
Prior Year
$ 127,900
90,000
545,000
Additional Information on Current Year Transactions
a. Purchased equipment for $68,200 cash.
b. Issued 13,900 shares of common stock for $5 cash per share.
c. Declared and paid $108,000 in cash dividends.
762,900
318,000
(113,500)
$ 967,400
$ 90,000
34,600
124,600
587,000
188,500
67,300
$ 967,400
$ 1,887,000
1,105,000
782,000
513,000
54,000
215,000
48,600
$ 166,400
Required:
Prepare a complete statement of cash flows using a spreadsheet under the indirect method.
Note: Enter all amounts as positive values.
Expert Solution
This question has been solved!
Explore an expertly crafted, step-by-step solution for a thorough understanding of key concepts.

This is a popular solution!

Trending now
This is a popular solution!

Step by step
Solved in 3 steps

Knowledge Booster


Learn more about
Need a deep-dive on the concept behind this application? Look no further. Learn more about this topic, accounting and related others by exploring similar questions and additional content below.Recommended textbooks for you
Cornerstones of Financial Accounting
Accounting
ISBN:
9781337690881
Author:
Jay Rich, Jeff Jones
Publisher:
Cengage Learning

Managerial Accounting
Accounting
ISBN:
9781337912020
Author:
Carl Warren, Ph.d. Cma William B. Tayler
Publisher:
South-Western College Pub

Cornerstones of Financial Accounting
Accounting
ISBN:
9781337690881
Author:
Jay Rich, Jeff Jones
Publisher:
Cengage Learning
Managerial Accounting
Accounting
ISBN:
9781337912020
Author:
Carl Warren, Ph.d. Cma William B. Tayler
Publisher:
South-Western College Pub
Principles of Accounting Volume 1
Accounting
ISBN:
9781947172685
Author:
OpenStax
Publisher:
OpenStax College

Financial Accounting: The Impact on Decision Make…
Accounting
ISBN:
9781305654174
Author:
Gary A. Porter, Curtis L. Norton
Publisher:
Cengage Learning

Financial Accounting
Accounting
ISBN:
9781305088436
Author:
Carl Warren, Jim Reeve, Jonathan Duchac
Publisher:
Cengage Learning