Google Image Changed

COMPREHENSIVE MICROSOFT OFFICE 365 EXCE
1st Edition
ISBN:9780357392676
Author:FREUND, Steven
Publisher:FREUND, Steven
Chapter8: Working With Trendlines, Pivottables, Pivotcharts, And Slicers
Section: Chapter Questions
Problem 8EYW

Related questions
Question
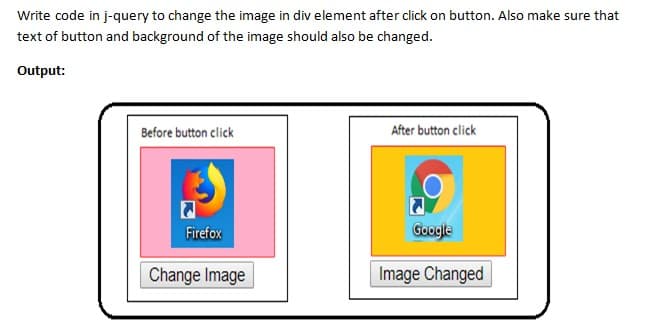
Transcribed Image Text:Write code in j-query to change the image in div element after click on button. Also make sure that
text of button and background of the image should also be changed.
Output:
Before button click
After button click
Firefox
Google
Change Image
Image Changed
Expert Solution
This question has been solved!
Explore an expertly crafted, step-by-step solution for a thorough understanding of key concepts.

Step by step
Solved in 3 steps with 2 images

Knowledge Booster


Learn more about
Need a deep-dive on the concept behind this application? Look no further. Learn more about this topic, computer-science and related others by exploring similar questions and additional content below.Recommended textbooks for you
COMPREHENSIVE MICROSOFT OFFICE 365 EXCE
Computer Science
ISBN:
9780357392676
Author:
FREUND, Steven
Publisher:
CENGAGE L

New Perspectives on HTML5, CSS3, and JavaScript
Computer Science
ISBN:
9781305503922
Author:
Patrick M. Carey
Publisher:
Cengage Learning

COMPREHENSIVE MICROSOFT OFFICE 365 EXCE
Computer Science
ISBN:
9780357392676
Author:
FREUND, Steven
Publisher:
CENGAGE L
New Perspectives on HTML5, CSS3, and JavaScript
Computer Science
ISBN:
9781305503922
Author:
Patrick M. Carey
Publisher:
Cengage Learning