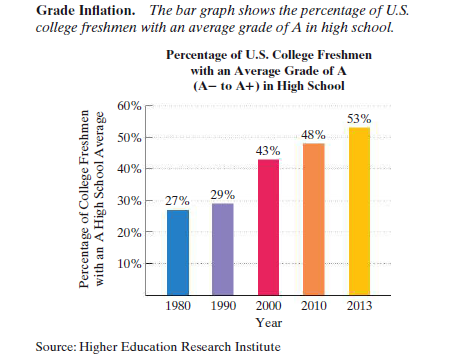
Grade Inflation. The bar graph shows the percentage of U.S. college freshmen with an average grade of A in high school. Percentage of U.S. College Freshmen with an Average Grade of A (A- to A+) in High School 60% 53% 50% 48% 43% 40% 29% 30% 27% 20% 10% 1980 1990 2000 2010 2013 Year Source: Higher Education Research Institute Percenta ge of College Freshmen with an A High School A verage


Equations and Inequations
Equations and inequalities describe the relationship between two mathematical expressions.
Linear Functions
A linear function can just be a constant, or it can be the constant multiplied with the variable like x or y. If the variables are of the form, x2, x1/2 or y2 it is not linear. The exponent over the variables should always be 1.
Grade Inflation. The bar graph shows the percentage of U.S. college freshmen with an average grade of A in high school.The data displayed by the bar graph can be described by the mathematical model : p = (4x / 5) + 25, where x is the number of years after 1980 and p is the percentage of U.S. college freshmen who had an average grade of A in high school. Use this information to solve:
a. According to the formula, in 2010, what percentage of U.S. college freshmen had an average grade of A in high school? Does this underestimate or overestimate the percent displayed by the bar graph? By how much?


Trending now
This is a popular solution!

Step by step
Solved in 2 steps


