Graph 2: The following data were collected during a study of the tadpole populations in nearby lakes. Survey of Tadpole Populations in Maryland Lakes NUMBER OF TADPOLES PER LAKE LITER LAKE WATER Needwood 145 Frank 69 Little Seneca 78 Pine 288 1. What is the dependent variable? 2. What is the independent variable? 3. Is the independent variable quantitative?
Graph 2: The following data were collected during a study of the tadpole populations in nearby lakes. Survey of Tadpole Populations in Maryland Lakes NUMBER OF TADPOLES PER LAKE LITER LAKE WATER Needwood 145 Frank 69 Little Seneca 78 Pine 288 1. What is the dependent variable? 2. What is the independent variable? 3. Is the independent variable quantitative?

Biology 2e
2nd Edition
ISBN:9781947172517
Author:Matthew Douglas, Jung Choi, Mary Ann Clark
Publisher:Matthew Douglas, Jung Choi, Mary Ann Clark
Chapter1: The Study Of Life
Section: Chapter Questions
Problem 5RQ: A suggested and testable explanation for an event is called a ________. hypothesis variable theory...

Related questions
Question
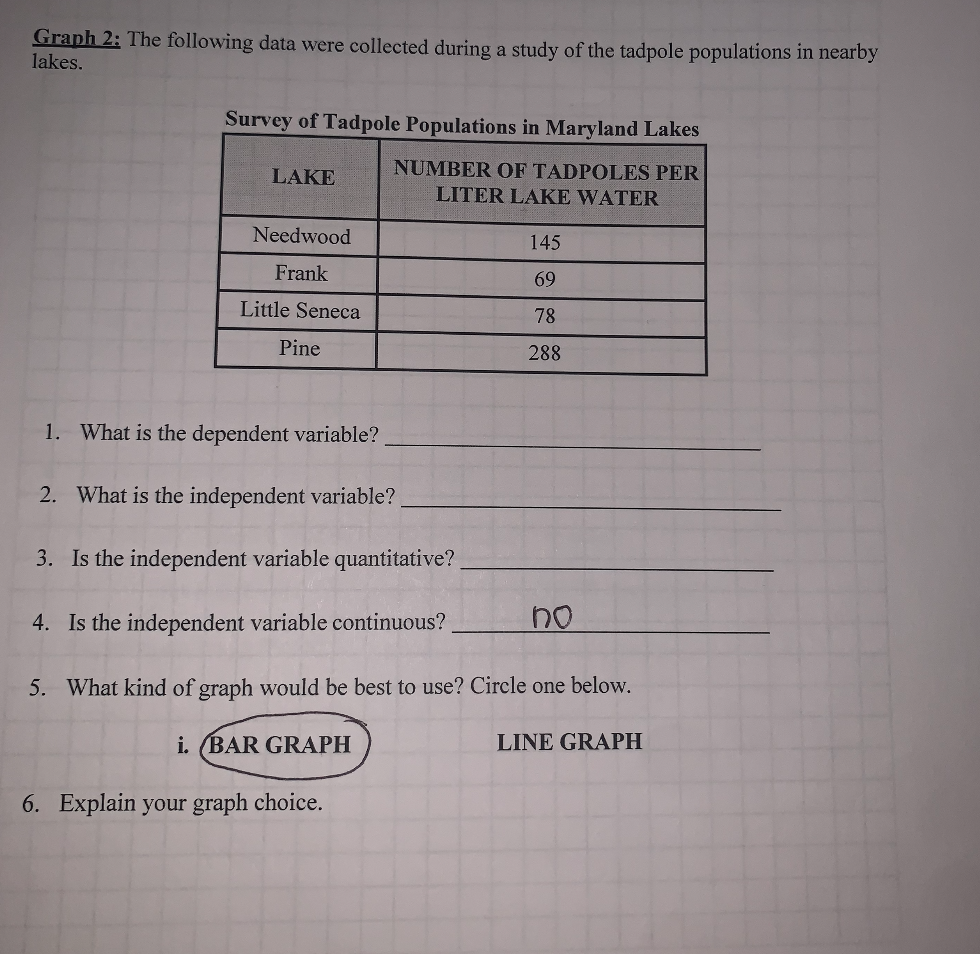
Transcribed Image Text:Graph 2: The following data were collected during a study of the tadpole populations in nearby
lakes.
Survey of Tadpole Populations in Maryland Lakes
NUMBER OF TADPOLES PER
LAKE
LITER LAKE WATER
Needwood
145
Frank
69
Little Seneca
78
Pine
288
1. What is the dependent variable?
2. What is the independent variable?
3. Is the independent variable quantitative?
4. Is the independent variable continuous?
5. What kind of graph would be best to use? Circle one below.
i. (BAR GRAPH
LINE GRAPH
6. Explain your graph choice.
Transcribed Image Text:7. Use TAILS (Title, Axes, Intervals, Labels, Scale) checklist and graph the data.
Expert Solution
Introduction
Hypothesis testing involves proposing a hypothesis, deciding the variables and measuring the variables. The experiments have different variables which are tweaked to see the changes. The variables are the parameters that can have more than one value in the experiment.

Trending now
This is a popular solution!

Step by step
Solved in 2 steps

Knowledge Booster


Learn more about
Need a deep-dive on the concept behind this application? Look no further. Learn more about this topic, biology and related others by exploring similar questions and additional content below.Recommended textbooks for you
Biology 2e
Biology
ISBN:
9781947172517
Author:
Matthew Douglas, Jung Choi, Mary Ann Clark
Publisher:
OpenStax

Biology (MindTap Course List)
Biology
ISBN:
9781337392938
Author:
Eldra Solomon, Charles Martin, Diana W. Martin, Linda R. Berg
Publisher:
Cengage Learning

Biology: The Unity and Diversity of Life (MindTap…
Biology
ISBN:
9781337408332
Author:
Cecie Starr, Ralph Taggart, Christine Evers, Lisa Starr
Publisher:
Cengage Learning
Biology 2e
Biology
ISBN:
9781947172517
Author:
Matthew Douglas, Jung Choi, Mary Ann Clark
Publisher:
OpenStax
Biology (MindTap Course List)
Biology
ISBN:
9781337392938
Author:
Eldra Solomon, Charles Martin, Diana W. Martin, Linda R. Berg
Publisher:
Cengage Learning
Biology: The Unity and Diversity of Life (MindTap…
Biology
ISBN:
9781337408332
Author:
Cecie Starr, Ralph Taggart, Christine Evers, Lisa Starr
Publisher:
Cengage Learning

Biology: The Dynamic Science (MindTap Course List)
Biology
ISBN:
9781305389892
Author:
Peter J. Russell, Paul E. Hertz, Beverly McMillan
Publisher:
Cengage Learning
