Graph f(x) = (x-2)* - 8. 40 32 24 16 -40 -16 -12 12 15 20 +16 24 32 40 32 24 16 -20 -16 -12 12 15 20 40- 32 24 16 -20 -16 -12 3 4 12 15 20 16 +24 +32 40 志岛
Graph f(x) = (x-2)* - 8. 40 32 24 16 -40 -16 -12 12 15 20 +16 24 32 40 32 24 16 -20 -16 -12 12 15 20 40- 32 24 16 -20 -16 -12 3 4 12 15 20 16 +24 +32 40 志岛

Algebra & Trigonometry with Analytic Geometry
13th Edition
ISBN:9781133382119
Author:Swokowski
Publisher:Swokowski
Chapter4: Polynomial And Rational Functions
Section4.5: Rational Functions
Problem 12E

Related questions
Question
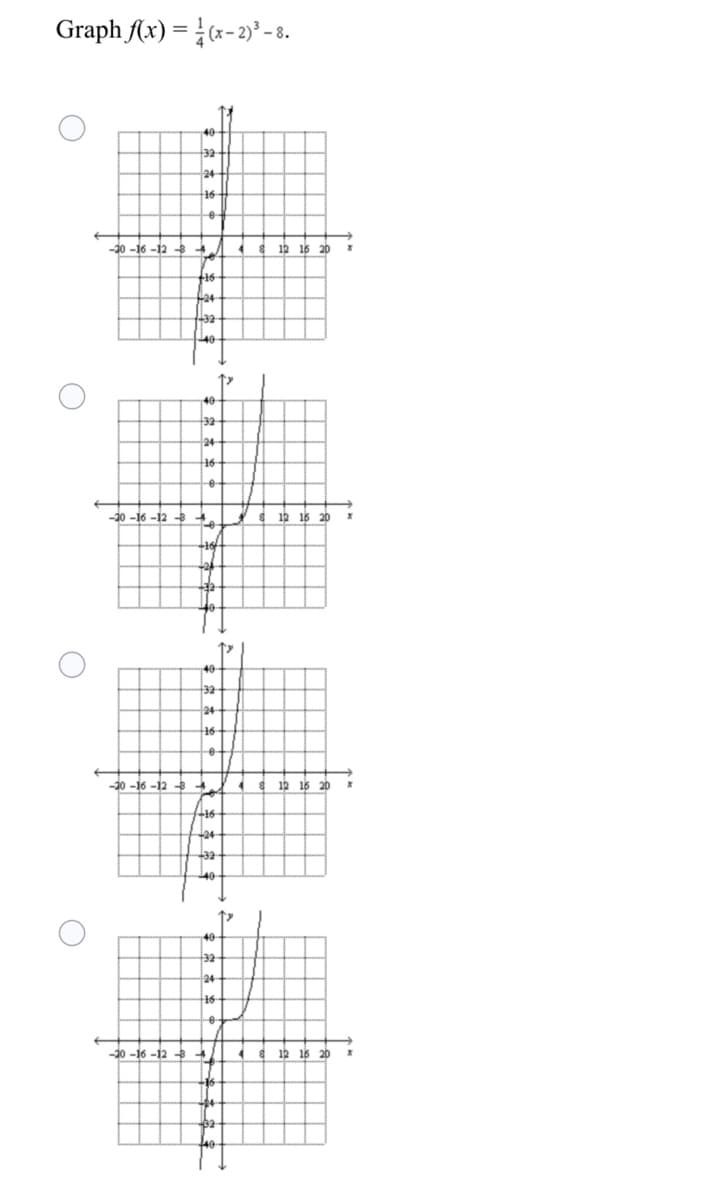
Transcribed Image Text:Graph (x) = (x-2)° -8.
40
32
24
16
-10 -16 -12
12
20
+16
+24
+32
40
32
24
-10 -16 -12
12 16 20
40
+32
24
-30-16 -12 8
4 8 12 16 20
+16
24
32
40
40
32
24
16
-10 -16 -12 -8
12 15 20
Expert Solution
This question has been solved!
Explore an expertly crafted, step-by-step solution for a thorough understanding of key concepts.

Step by step
Solved in 2 steps with 1 images

Recommended textbooks for you
Algebra & Trigonometry with Analytic Geometry
Algebra
ISBN:
9781133382119
Author:
Swokowski
Publisher:
Cengage
Algebra & Trigonometry with Analytic Geometry
Algebra
ISBN:
9781133382119
Author:
Swokowski
Publisher:
Cengage