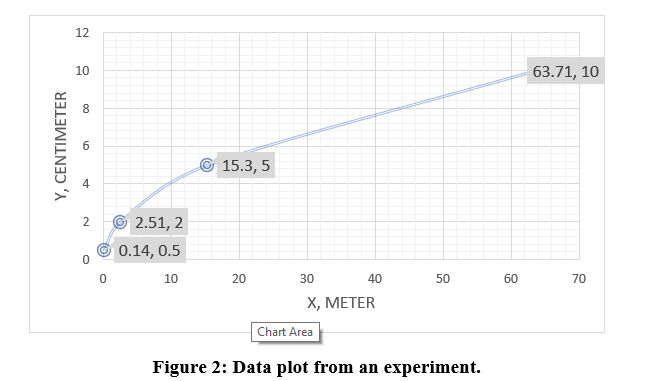
Graph in Figure 2 have the form of y = axb. Estimate the static sensitivity K at each value of X.


Theory and Design for Mechanical Measurements
Measurement is a term that refers to analyzing a manufactured component regarding the degree of accuracy for dimensions, tolerances, geometric profile, roundness, flatness, smoothness, etc. Measurement always involves comparing the manufactured component or the prototype with a standard specimen whose dimensions and other parameters are assumed to be perfect and do not undergo changes with respect to time.Precisely in mechanical engineering the branch that deals with the application of scientific principles for measurements is known as metrology. The domain of metrology in general deals with various measurements like mechanical, chemical, thermodynamic, physical, and biological measurements. In mechanical engineering, the measurements are limited to mechanical specific such as length, mass, surface profile, flatness, roundness, viscosity, heat transfer, etc.
Basic principles of engineering metrology
Metrology is described as the science of measurement, precision, and accuracy. In other words, it is a method of measurement based on units and predefined standards.
- Graph in Figure 2 have the form of y = axb. Estimate the static sensitivity K at each value of X.

Step by step
Solved in 4 steps with 11 images


