Graph the function f(x) = sin x on the interval [- 7,x), showing the addition of the rectangles associated with the Riemann sum > f(a)Ax, given that c, is the left endpoint of the kth subinterval. k=1 Choose the correct graph. OB. Oc. A
Graph the function f(x) = sin x on the interval [- 7,x), showing the addition of the rectangles associated with the Riemann sum > f(a)Ax, given that c, is the left endpoint of the kth subinterval. k=1 Choose the correct graph. OB. Oc. A

Linear Algebra: A Modern Introduction
4th Edition
ISBN:9781285463247
Author:David Poole
Publisher:David Poole
Chapter7: Distance And Approximation
Section7.5: Applications
Problem 17EQ

Related questions
Question
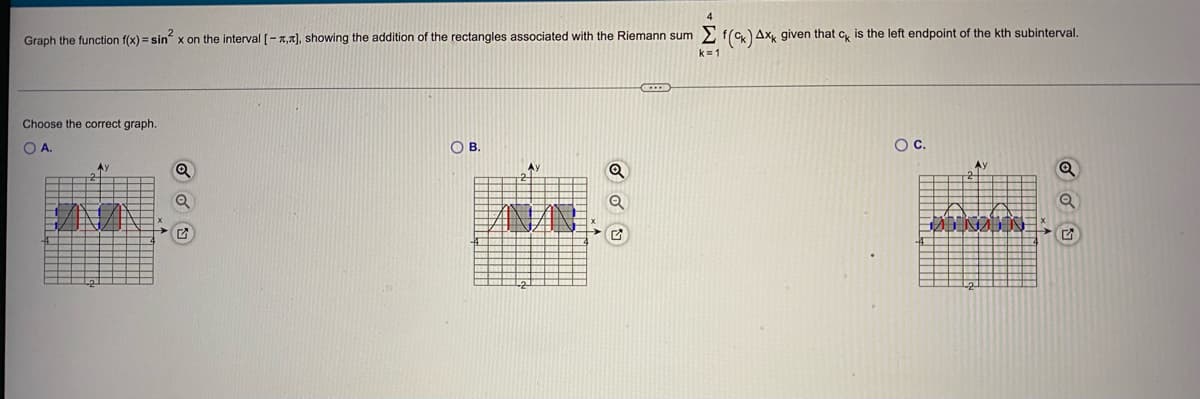
Transcribed Image Text:Graph the function f(x) = sin x on the interval [-7,1), showing the addition of the rectangles associated with the Riemann sum> f(c,Ax, given that c, is the left endpoint of the kth subinterval.
k=1
Choose the correct graph.
OA.
OB.
Oc.
Ay
Ay
Expert Solution
This question has been solved!
Explore an expertly crafted, step-by-step solution for a thorough understanding of key concepts.

Step by step
Solved in 3 steps

Recommended textbooks for you
Linear Algebra: A Modern Introduction
Algebra
ISBN:
9781285463247
Author:
David Poole
Publisher:
Cengage Learning

Algebra & Trigonometry with Analytic Geometry
Algebra
ISBN:
9781133382119
Author:
Swokowski
Publisher:
Cengage
Linear Algebra: A Modern Introduction
Algebra
ISBN:
9781285463247
Author:
David Poole
Publisher:
Cengage Learning
Algebra & Trigonometry with Analytic Geometry
Algebra
ISBN:
9781133382119
Author:
Swokowski
Publisher:
Cengage