Graphs of the velocity functions of two particles are shown, where t is measured in seconds. (a) When is the particle speeding up? (Enter your answer using interval notation.) When is the particle slowing down? (Enter your answer using interval notation.) (b) When is the particle speeding up? (Enter your answer using interval notation.) When is the particle slowing down? (Enter your answer using interval notation.)
Graphs of the velocity functions of two particles are shown, where t is measured in seconds. (a) When is the particle speeding up? (Enter your answer using interval notation.) When is the particle slowing down? (Enter your answer using interval notation.) (b) When is the particle speeding up? (Enter your answer using interval notation.) When is the particle slowing down? (Enter your answer using interval notation.)

Algebra & Trigonometry with Analytic Geometry
13th Edition
ISBN:9781133382119
Author:Swokowski
Publisher:Swokowski
Chapter3: Functions And Graphs
Section3.4: Definition Of Function
Problem 72E

Related questions
Question
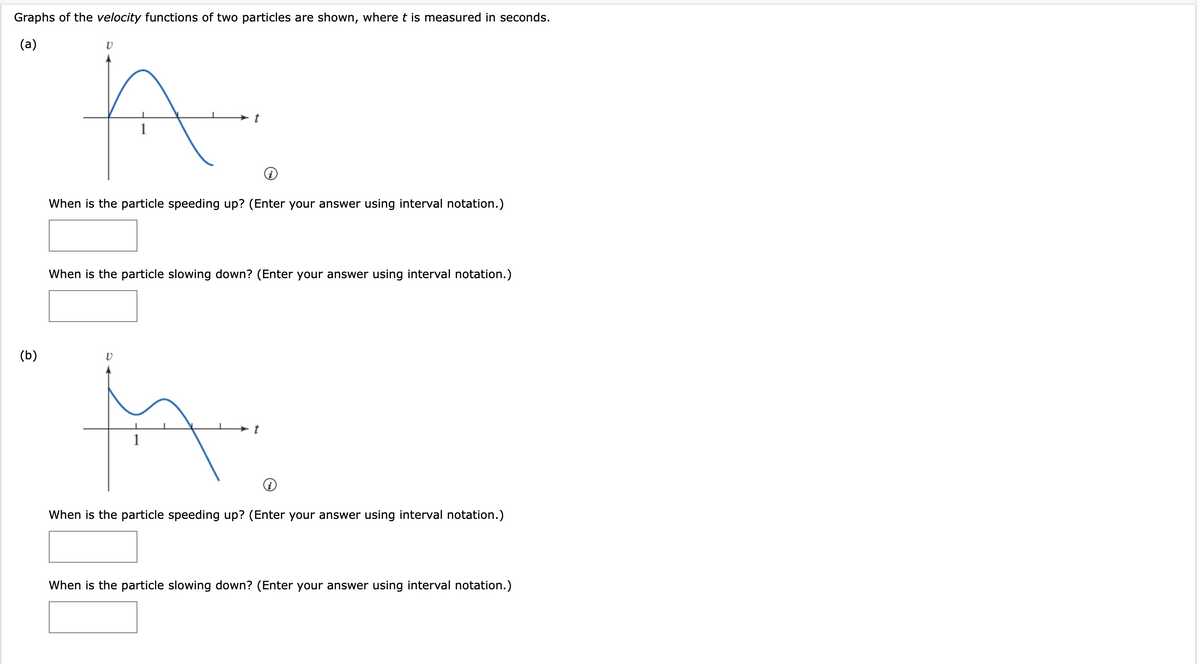
Transcribed Image Text:Graphs of the velocity functions of two particles are shown, where t is measured in seconds.
(a)
1
When is the particle speeding up? (Enter your answer using interval notation.)
When is the particle slowing down? (Enter your answer using interval notation.)
(b)
When is the particle speeding up? (Enter your answer using interval notation.)
When is the particle slowing down? (Enter your answer using interval notation.)
Expert Solution
This question has been solved!
Explore an expertly crafted, step-by-step solution for a thorough understanding of key concepts.

This is a popular solution!

Trending now
This is a popular solution!

Step by step
Solved in 2 steps with 2 images

Recommended textbooks for you
Algebra & Trigonometry with Analytic Geometry
Algebra
ISBN:
9781133382119
Author:
Swokowski
Publisher:
Cengage


Functions and Change: A Modeling Approach to Coll…
Algebra
ISBN:
9781337111348
Author:
Bruce Crauder, Benny Evans, Alan Noell
Publisher:
Cengage Learning
Algebra & Trigonometry with Analytic Geometry
Algebra
ISBN:
9781133382119
Author:
Swokowski
Publisher:
Cengage
Functions and Change: A Modeling Approach to Coll…
Algebra
ISBN:
9781337111348
Author:
Bruce Crauder, Benny Evans, Alan Noell
Publisher:
Cengage Learning