> Question 21 A population of 770,000 microbes increases at the continuous rate of 12.6% per day. Draw the graph of a function that models the situation. 3080000+ 2695000+ 2310000- 1925000 1540000- 1155000- 770000 385000 -5 20 25 -385000- -770000+ Clear All Draw: The vertical (y) intercept is 15 -10 5 10 15 /// 30 35
> Question 21 A population of 770,000 microbes increases at the continuous rate of 12.6% per day. Draw the graph of a function that models the situation. 3080000+ 2695000+ 2310000- 1925000 1540000- 1155000- 770000 385000 -5 20 25 -385000- -770000+ Clear All Draw: The vertical (y) intercept is 15 -10 5 10 15 /// 30 35

College Algebra
7th Edition
ISBN:9781305115545
Author:James Stewart, Lothar Redlin, Saleem Watson
Publisher:James Stewart, Lothar Redlin, Saleem Watson
Chapter2: Functions
Section: Chapter Questions
Problem 7T

Related questions
Question
Transcribed Image Text:IZLE IS
>
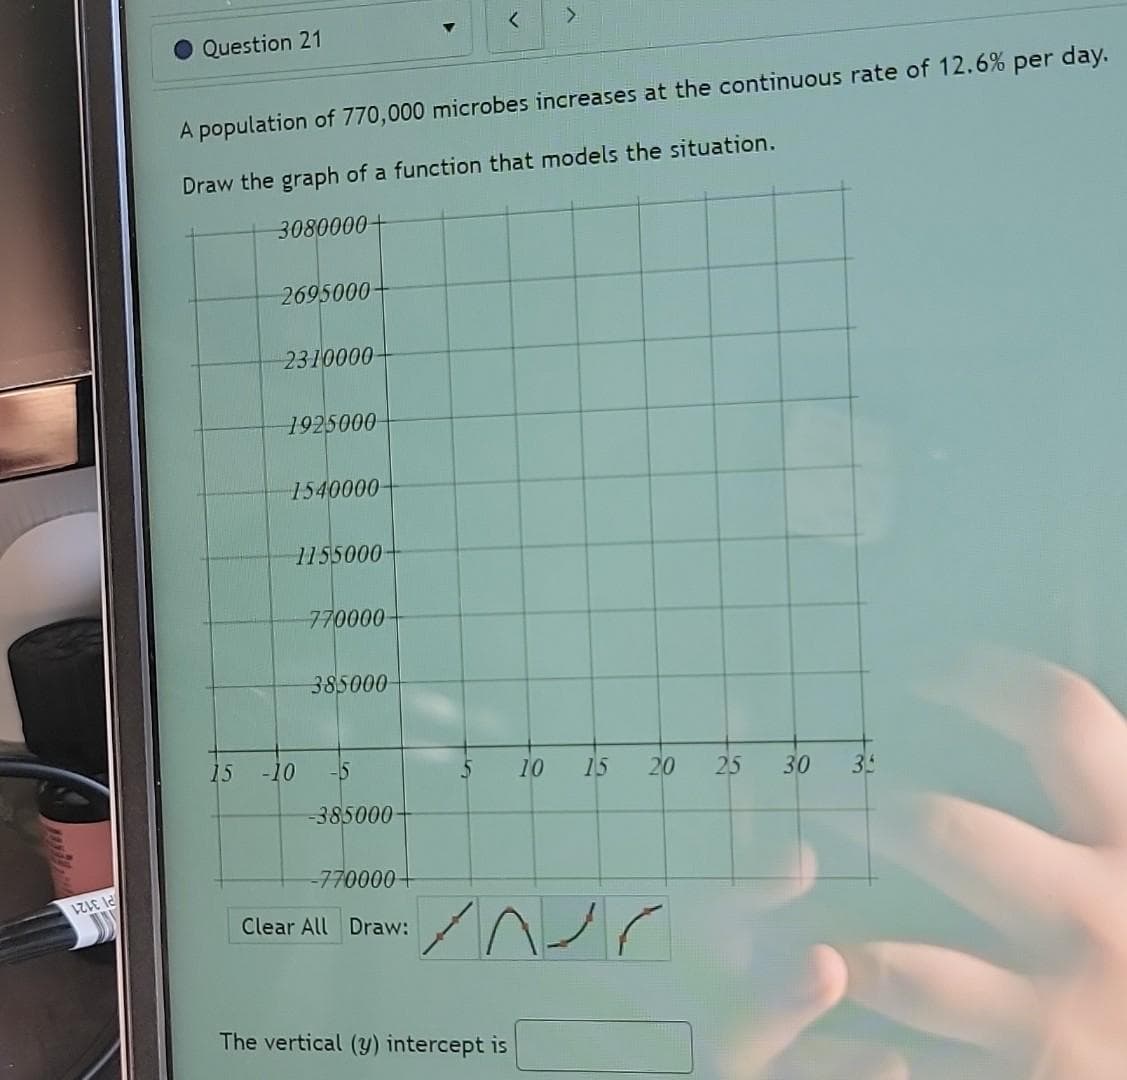
Question 21
A population of 770,000 microbes increases at the continuous rate of 12.6% per day.
Draw the graph of a function that models the situation.
3080000+
2695000
2310000-
1925000
1540000
1155000
20 25
30
770000-
385000
-5
-385000-
-770000+
Clear All Draw:
The vertical (y) intercept is
15
-10
5
10
15
INC
35
Expert Solution
This question has been solved!
Explore an expertly crafted, step-by-step solution for a thorough understanding of key concepts.

Step by step
Solved in 2 steps with 2 images

Recommended textbooks for you
College Algebra
Algebra
ISBN:
9781305115545
Author:
James Stewart, Lothar Redlin, Saleem Watson
Publisher:
Cengage Learning


College Algebra
Algebra
ISBN:
9781305115545
Author:
James Stewart, Lothar Redlin, Saleem Watson
Publisher:
Cengage Learning


Algebra for College Students
Algebra
ISBN:
9781285195780
Author:
Jerome E. Kaufmann, Karen L. Schwitters
Publisher:
Cengage Learning

Elementary Linear Algebra (MindTap Course List)
Algebra
ISBN:
9781305658004
Author:
Ron Larson
Publisher:
Cengage Learning