Group1 Group2 1199 459 1182 509 1210 524 1223 494 1172 444 1190 540 1203 468 1240 488 1200 384 1176 485 1220 491 1235 465 1198 376 1209 1208 487 556 For the two datasets, calculate the descriptive statistics (Mean, Median, Mode, Std Deviation, Range, Q1, Median, Q3) Describe the data. Mean=1,204.33-478 Median= 1203,487 Mode=68,180 Create a boxplot for each of the datasets on the same graph.
Group1 Group2 1199 459 1182 509 1210 524 1223 494 1172 444 1190 540 1203 468 1240 488 1200 384 1176 485 1220 491 1235 465 1198 376 1209 1208 487 556 For the two datasets, calculate the descriptive statistics (Mean, Median, Mode, Std Deviation, Range, Q1, Median, Q3) Describe the data. Mean=1,204.33-478 Median= 1203,487 Mode=68,180 Create a boxplot for each of the datasets on the same graph.

Functions and Change: A Modeling Approach to College Algebra (MindTap Course List)
6th Edition
ISBN:9781337111348
Author:Bruce Crauder, Benny Evans, Alan Noell
Publisher:Bruce Crauder, Benny Evans, Alan Noell
Chapter3: Straight Lines And Linear Functions
Section3.3: Modeling Data With Linear Functions
Problem 15SBE

Related questions
Question
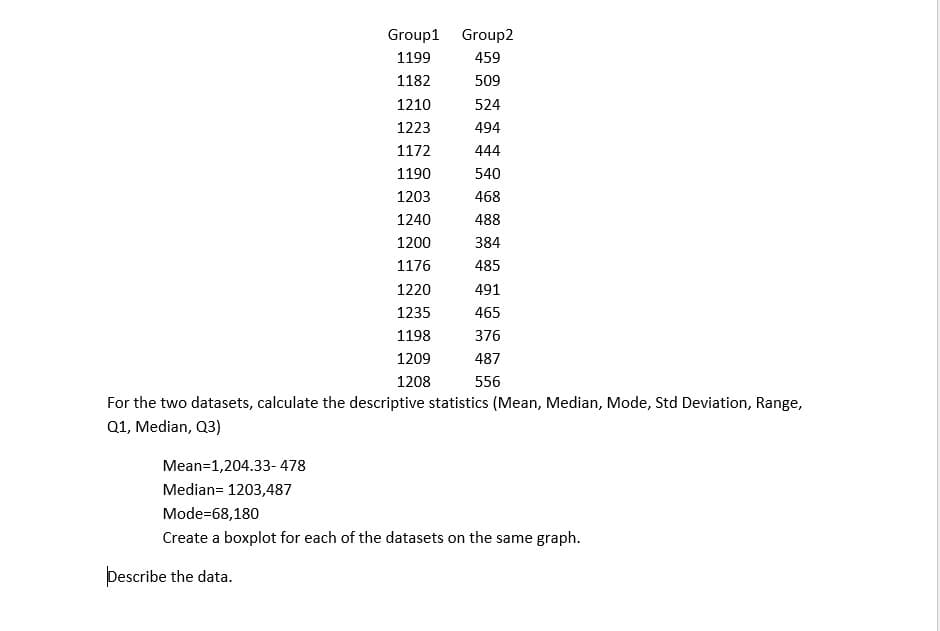
Transcribed Image Text:Group1 Group2
1199
459
1182
509
1210
524
1223
494
1172
444
1190
540
1203
468
1240
488
1200
384
1176
485
1220
1235
1198
1209
1208
491
465
376
487
556
For the two datasets, calculate the descriptive statistics (Mean, Median, Mode, Std Deviation, Range,
Q1, Median, Q3)
Describe the data.
Mean=1,204.33-478
Median= 1203,487
Mode=68,180
Create a boxplot for each of the datasets on the same graph.
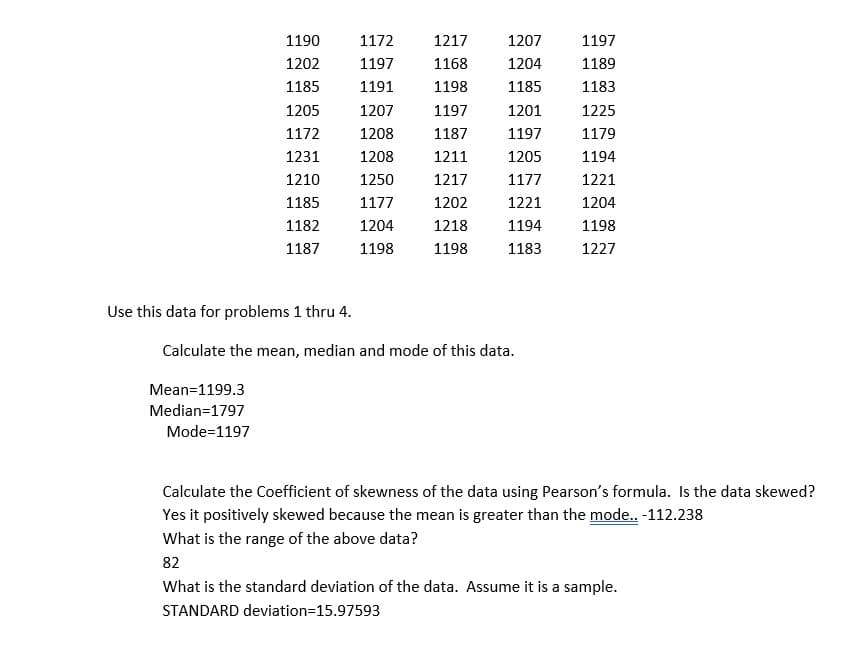
Transcribed Image Text:1190
1202
1185
1205
1172
1231
1210
1185
1182
1187
Use this data for problems 1 thru 4.
1172
1197
1191
1207
1208
1208
1250
1177
1204
1198
1217
1168
1198
1197
1187
1211
1217
1202
1218
1198
1207
1204
1185
1201
1197
1205
1177
1221
1194
1183
Calculate the mean, median and mode of this data.
Mean=1199.3
Median=1797
Mode=1197
1197
1189
1183
1225
1179
1194
1221
1204
1198
1227
Calculate the Coefficient of skewness of the data using Pearson's formula. Is the data skewed?
Yes it positively skewed because the mean is greater than the mode.. -112.238
What is the range of the above data?
82
What is the standard deviation of the data. Assume it is a sample.
STANDARD deviation=15.97593
Expert Solution
This question has been solved!
Explore an expertly crafted, step-by-step solution for a thorough understanding of key concepts.

Step by step
Solved in 4 steps

Recommended textbooks for you
Functions and Change: A Modeling Approach to Coll…
Algebra
ISBN:
9781337111348
Author:
Bruce Crauder, Benny Evans, Alan Noell
Publisher:
Cengage Learning
Functions and Change: A Modeling Approach to Coll…
Algebra
ISBN:
9781337111348
Author:
Bruce Crauder, Benny Evans, Alan Noell
Publisher:
Cengage Learning