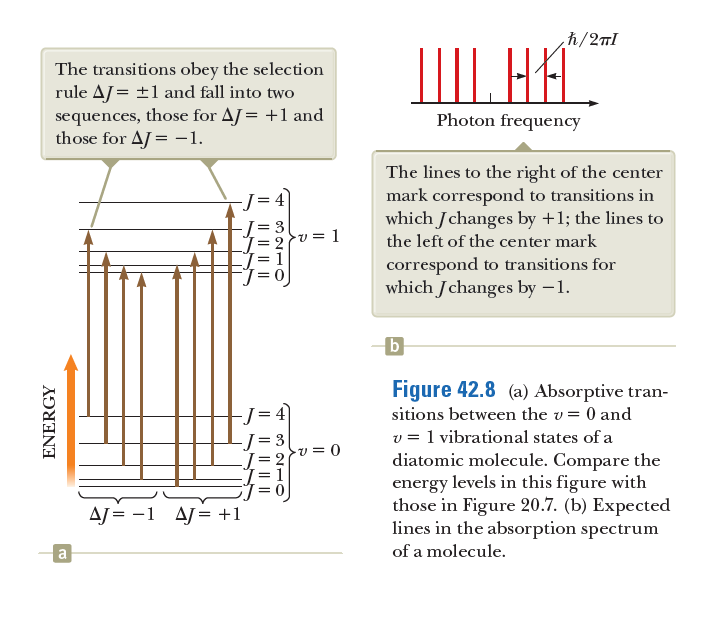
h/2nl The transitions obey the selection rule AJ = ±1 and fall into two sequences, those for AJ= +1 and those for AJ = -1. IIII. HA. Photon frequency The lines to the right of the center mark correspond to transitions in which Jchanges by +1; the lines to -J= 4 = 3 v = 1 the left of the center mark correspond to transitions for which Jchanges by –1. b Figure 42.8 (a) Absorptive tran- -J= 4 sitions between the v= 0 and v = 1 vibrational states of a diatomic molecule. Compare the energy levels in this figure with those in Figure 20.7. (b) Expected lines in the absorption spectrum -v = 0 AJ = -1 AJ= +1 a of a molecule. IL || ||| I| || || || ENERGY Each line is split into a doublet because the sample contains two chlorine isotopes that have different masses and therefore different moments of inertia. Figure 42.9 Experimental absorption spectrum of the HCI molecule. 8.0 8.2 8.4 8.6 8.8 9.0 9.2 Frequency (X 1013 Hz)
h/2nl The transitions obey the selection rule AJ = ±1 and fall into two sequences, those for AJ= +1 and those for AJ = -1. IIII. HA. Photon frequency The lines to the right of the center mark correspond to transitions in which Jchanges by +1; the lines to -J= 4 = 3 v = 1 the left of the center mark correspond to transitions for which Jchanges by –1. b Figure 42.8 (a) Absorptive tran- -J= 4 sitions between the v= 0 and v = 1 vibrational states of a diatomic molecule. Compare the energy levels in this figure with those in Figure 20.7. (b) Expected lines in the absorption spectrum -v = 0 AJ = -1 AJ= +1 a of a molecule. IL || ||| I| || || || ENERGY Each line is split into a doublet because the sample contains two chlorine isotopes that have different masses and therefore different moments of inertia. Figure 42.9 Experimental absorption spectrum of the HCI molecule. 8.0 8.2 8.4 8.6 8.8 9.0 9.2 Frequency (X 1013 Hz)

Related questions
Question
In 42.8a, the transitions indicated correspond to spectral lines that are equally spaced as shown in 42.8b. The actual spectrum in 42.9, however, shows lines that move closer together as the frequency increases. Why does the spacing of the actual spectral lines differ from the diagram in 42.8b?
Transcribed Image Text:h/2nl
The transitions obey the selection
rule AJ = ±1 and fall into two
sequences, those for AJ= +1 and
those for AJ = -1.
IIII. HA.
Photon frequency
The lines to the right of the center
mark correspond to transitions in
which Jchanges by +1; the lines to
-J= 4
= 3
v = 1
the left of the center mark
correspond to transitions for
which Jchanges by –1.
b
Figure 42.8 (a) Absorptive tran-
-J= 4
sitions between the v= 0 and
v = 1 vibrational states of a
diatomic molecule. Compare the
energy levels in this figure with
those in Figure 20.7. (b) Expected
lines in the absorption spectrum
-v = 0
AJ = -1 AJ= +1
a
of a molecule.
IL || |||
I| || || ||
ENERGY
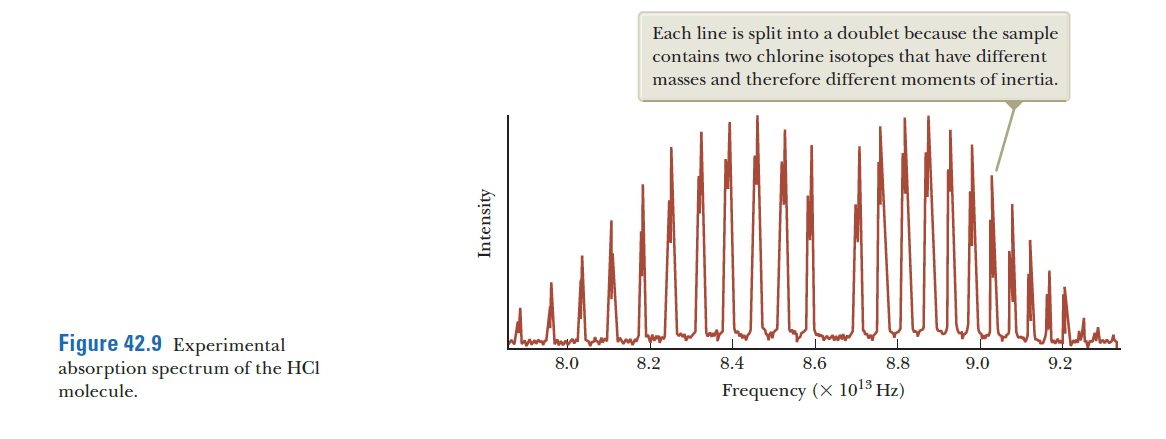
Transcribed Image Text:Each line is split into a doublet because the sample
contains two chlorine isotopes that have different
masses and therefore different moments of inertia.
Figure 42.9 Experimental
absorption spectrum of the HCI
molecule.
8.0
8.2
8.4
8.6
8.8
9.0
9.2
Frequency (X 1013 Hz)
Expert Solution
This question has been solved!
Explore an expertly crafted, step-by-step solution for a thorough understanding of key concepts.

This is a popular solution!

Trending now
This is a popular solution!

Step by step
Solved in 2 steps with 2 images
