Q: Does the graph represent a function? of True False
A:
Q: Which graph shows relative maximum value of 3? *
A:
Q: A farmer wants to build a rectangular fence around a plot of land. However, 1.5 sides of the plot of…
A: The side of fencing parallel to the river is w. The fencing needed is 1000 ft. Let l be the length…
Q: Sketch the graph of the function
A:
Q: Explain how the vertical line test is used to determine whether a graph represents a function ?
A: For function we know that it is should be one-one or on to for one-one at one value of x .It is…
Q: What is the input value in a function?
A: Input values
Q: Which graph best represents a function with a range of all real numbers greater than or equal to 8?
A: For (a), Similarly, for (B) the range is (-∞,-8]. And the range of (C) is [8,∞).
Q: What is the graph of this function
A: given functionF(x)=x-2 ; x≤-2 2 ;-2<x≤0 4-x2-;0<x≤2 x+4…
Q: tion: -15 +10 1-5 15 10 5 ↑ 5 10 -15 10 >X 15
A:
Q: Which function below matches this graph?
A: WE need to analyze the given graph. We know that sec(x) graph is a U shaded graph . sec(x) graph…
Q: In Problem,is the graph shown the graph of a function?
A: Draw vertical lines parallel to the y-axis.
Q: The graph of a square root function has a domain of (0, ∞) and range of [1, 0). In two or more…
A:
Q: Sketch the graph of g(x) = 2Vx + Vx*. Support your graph by a table as in the lecture.
A:
Q: What is the graph of a real-valued function of a real variable?
A: What is the graph of a real-valued function of a real variable.
Q: Suppose that the graph of a function f is known. Explainhow the graph of y = f1x2 - 2 differs from…
A: How the graph of y = f1x2 - 2 differs from the graph of y = f1x2 - 22. The graph will be same but…
Q: Find the vertex and axis of symmetry of the graph of the function
A:
Q: Is this graph a function?
A: We have given a graph, we have to check whether the given graph is a function or not. We will use…
Q: Use end behavior to explain why f(x) = -49x3 + 806x2 + 3776x + 2503 is only an appropriate model for…
A: Consider the polynomial: fx=-49x3+806x2+3776x+2503Leading Coefficient=-49NegativeDegree=3Odd If the…
Q: What is the domain and range of the graphed function?
A:
Q: What is the Scaling and Reflecting a Graph of a Function?
A: Concept: A definition of a function is that a relation from a set of inputs to a set of possible…
Q: What’s the maximum of this function?
A: Maximum value attained at x=0
Q: Is the type of function a quadratic function, absolute value function, cubic function, or a constant…
A:
Q: Sketch the graph of f(x) = 6**4
A: It is given that F(x)=6x+4 Now we want to draw the graph of F(x) So we will…
Q: What is the graph of a function?
A: A function is that whose graph satisfies the vertical line test. That is, if we draw a vertical line…
Q: Can the graph of a function cross a horizontal asymptote? Explain.
A:
Q: Based on the graph, determine if the function is linear or nonlinear. If it is nonlinear, name the…
A: 1) This function is not a linear function. Because the given function is not a line.It is a cubic…
Q: Can you explain how to make the piecewise function of the graph
A: The piecewise function of the graph is found as shown below.
Q: What is the domain of the function graphed below?
A: Using the graph we can conclude than the domain of the function is [-5,α]
Q: What is the function rule for the graph. below?
A: Consider a line passes through two points with coordinates x1,y1 and x2,y2. The equation of the…
Q: Identify the location and value of any relative maxima or minima of the function. If there is more…
A: Given that:
Q: Describe the end behavior of the function graphed below
A:
Q: Can the graph of a function be symmetric about the y-axis? If your answer is "No" explain why. If…
A: Yes the graph of function can be symmetric about the y-axis.
Q: Give conceptual discussion about the increasing and decreasing functions, concavity and convexity.…
A:
Q: The graph of y ={(x) = V- 9 is horizontally stretched away from the y-axis by a factor of3 to…
A: fx=x-9
Q: 2. Is this a graph of a function? Explain your y reasoning. (abr 6. 4
A: Topic:- function
Q: Sketch the graph of the function:
A: As per our guidelines we are supposed to answer first 3 subparts of the question. Kindly repost…
Q: Define the term shifting a graph of function?
A: we have to define the term shifting a graph of function.
Q: The graph of a function has a zero with a multiplicity of two. This means?
A: The given statement is "The graph of a function has a zero with a multiplicity of two".
Q: Does a relative maximum of a function always have the largesty-value in the domain of the function?…
A: A relative maximum point is a point where the function changes direction from increasing to…
Q: Considered the graph of Function a.
A:
Q: Sketch a graph of the function, explaining from the formulas: the key points, end behavior,…
A:
Q: Sketch a graph of BMI against weight for a person of constant height. BMI Sketch a graph of BMI…
A: The graph of y=kx is a straight line that has a slope of k and it passes through the origin.
Q: Which piecewise function is shown on the graph?
A: from the graph : for Therefore, Option D can be eliminated.
Q: What is the midline of the function graphed below?
A: Given , We have to find the midline of the function
Q: Create a graph of a function that would meet the following criteria: its domain = (-2,4] its…
A: Given: Domain: (-2,4]Range: [-3,9) To Find: A graph of a function that satisfies the following…
Q: In the last year of the data, a car enthusiast spends $15,100 on a car of the given model that is in…
A: Given: Let us consider the given data, Enthusiast spends=$15100 Owner spends=$8300 Total…
Q: What is the graph of a real-valued function of a real variable? What is the vertical line test?
A: The graph of a real-valued function is a line, straight or curve which shows the variation of one…
Q: Explain how the graph also represents a linear piecewise function.
A: "Since you have asked multiple questions we will solve the first question for you. If you want any…
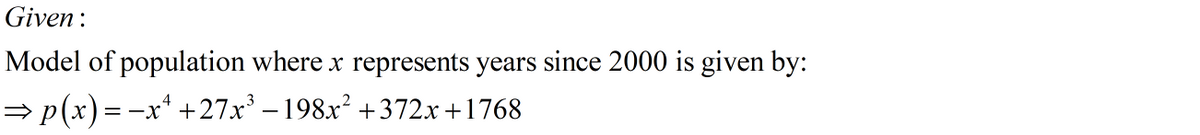
What impact does the leading coeffiecient have in the graph of this function?
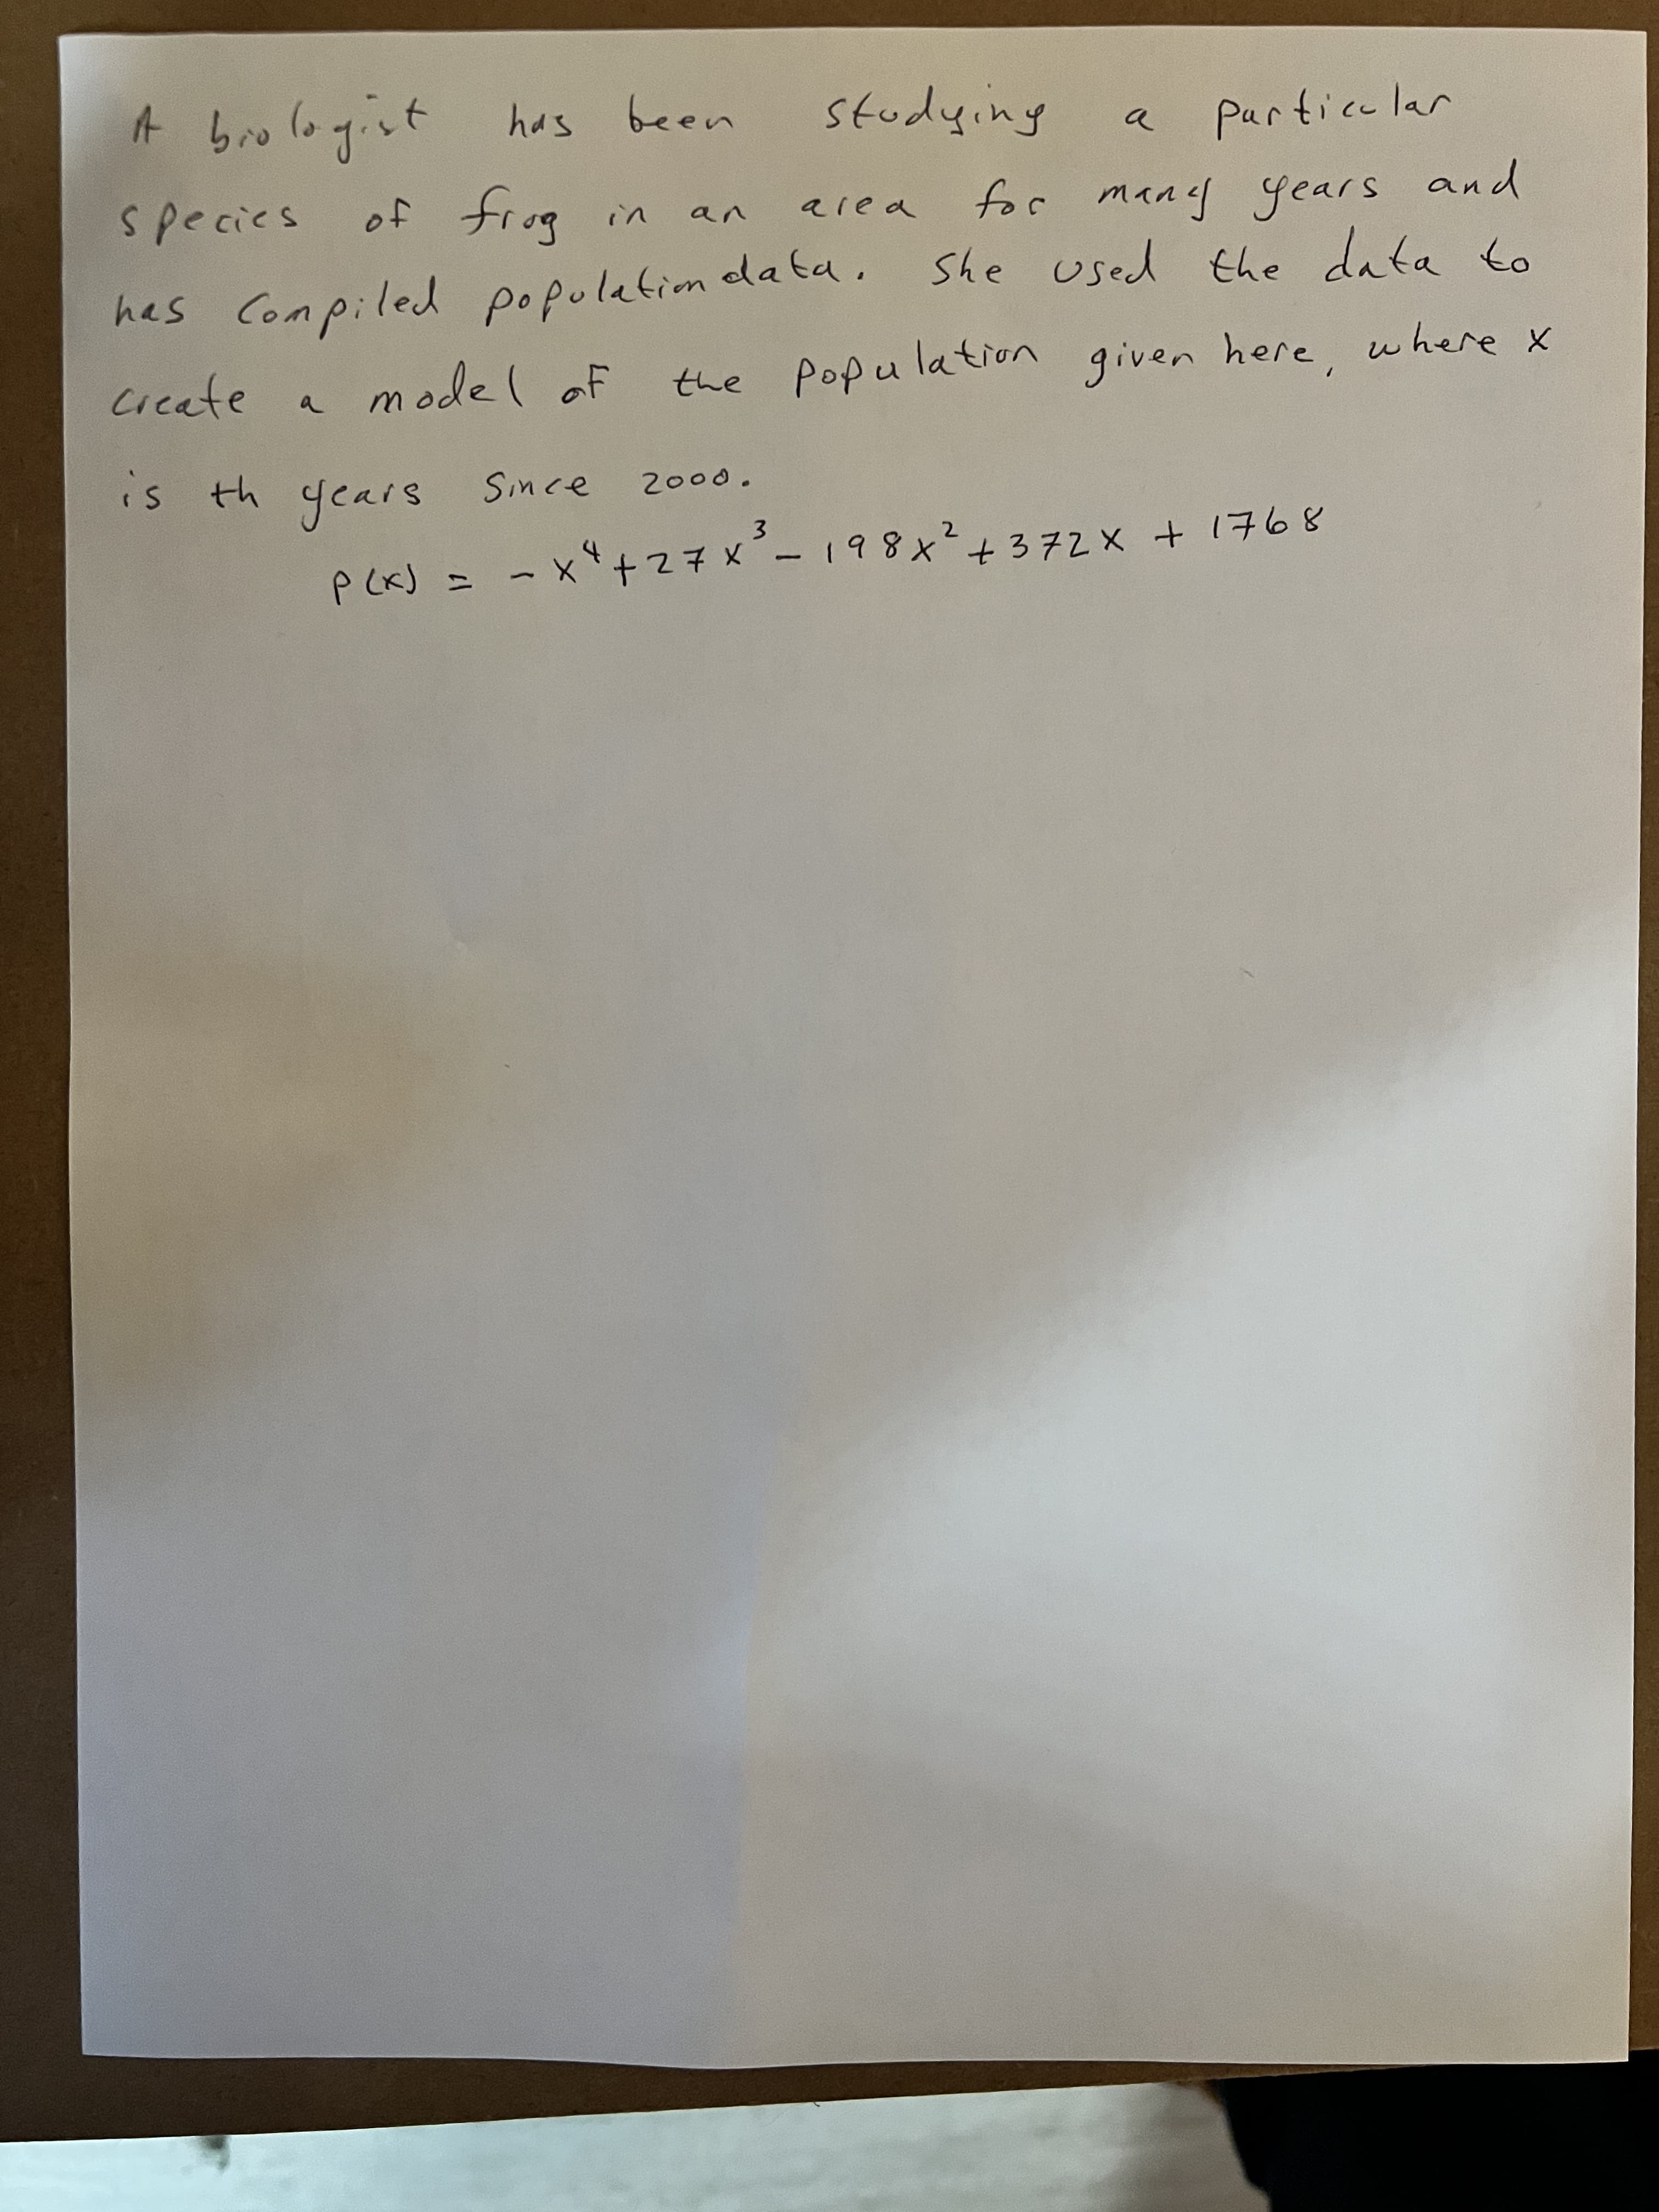
Step by step
Solved in 2 steps with 2 images