he graph of a sinusoidal function is shown. Describe this graph by determining its: • range • the equation of its midline . its amplitude • its period. how your work. 90° 180 270° 360°
he graph of a sinusoidal function is shown. Describe this graph by determining its: • range • the equation of its midline . its amplitude • its period. how your work. 90° 180 270° 360°

Algebra & Trigonometry with Analytic Geometry
13th Edition
ISBN:9781133382119
Author:Swokowski
Publisher:Swokowski
Chapter6: The Trigonometric Functions
Section6.6: Additional Trigonometric Graphs
Problem 11E

Related questions
Question
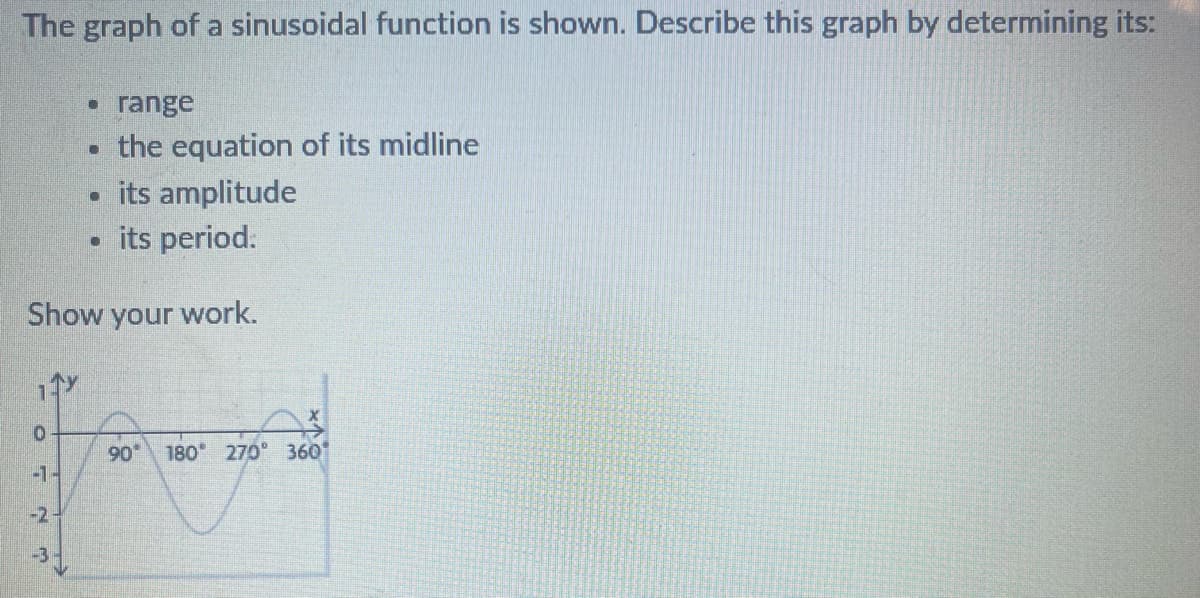
Transcribed Image Text:The graph of a sinusoidal function is shown. Describe this graph by determining its:
-1-
-2-
• range
the equation of its midline
its amplitude
-3
0
• its period.
Show your work.
D
90° 180 270° 360°
Expert Solution
This question has been solved!
Explore an expertly crafted, step-by-step solution for a thorough understanding of key concepts.

Step by step
Solved in 3 steps

Recommended textbooks for you
Algebra & Trigonometry with Analytic Geometry
Algebra
ISBN:
9781133382119
Author:
Swokowski
Publisher:
Cengage
Algebra & Trigonometry with Analytic Geometry
Algebra
ISBN:
9781133382119
Author:
Swokowski
Publisher:
Cengage