he trigonometric function y =2 sinz-) We will fil out the table and plot S points so that we can see the graph and sketch it. Solve for z from last line Solve for y The 5 points arexfrom row 2 vvalue from row 4 e5 points, we know that the graph of sine looks like a wave. Hence, the graph can be sketched with the 5 points. You can extend the graph by copving the graph from the 5 points to the left and right because the graph of sine function is periodic
he trigonometric function y =2 sinz-) We will fil out the table and plot S points so that we can see the graph and sketch it. Solve for z from last line Solve for y The 5 points arexfrom row 2 vvalue from row 4 e5 points, we know that the graph of sine looks like a wave. Hence, the graph can be sketched with the 5 points. You can extend the graph by copving the graph from the 5 points to the left and right because the graph of sine function is periodic

Algebra & Trigonometry with Analytic Geometry
13th Edition
ISBN:9781133382119
Author:Swokowski
Publisher:Swokowski
Chapter6: The Trigonometric Functions
Section6.6: Additional Trigonometric Graphs
Problem 63E

Related questions
Question
Transcribed Image Text:in;-- -).
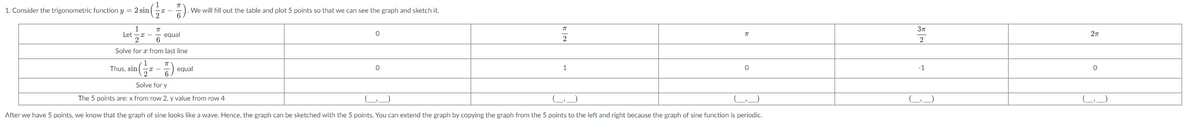
1. Consider the trigonometric function y = 2 sin
.We will fill out the table and plot 5 points so that we can see the graph and sketch it.
37
1
Let
27
equal
2
2
Solve for æ from last line
Thus, sin x -
equal
Solve for y
The 5 points are: x from row 2, y value from row 4
After we have 5 points, we know that the graph of sine looks like a wave. Hence, the graph can be sketched with the 5 points. You can extend the graph by copying the graph from the 5 points to the left and right because the graph of sine function is periodic.
Expert Solution
This question has been solved!
Explore an expertly crafted, step-by-step solution for a thorough understanding of key concepts.

Step by step
Solved in 3 steps with 3 images

Recommended textbooks for you
Algebra & Trigonometry with Analytic Geometry
Algebra
ISBN:
9781133382119
Author:
Swokowski
Publisher:
Cengage

Trigonometry (MindTap Course List)
Trigonometry
ISBN:
9781305652224
Author:
Charles P. McKeague, Mark D. Turner
Publisher:
Cengage Learning
Algebra & Trigonometry with Analytic Geometry
Algebra
ISBN:
9781133382119
Author:
Swokowski
Publisher:
Cengage
Trigonometry (MindTap Course List)
Trigonometry
ISBN:
9781305652224
Author:
Charles P. McKeague, Mark D. Turner
Publisher:
Cengage Learning