Here is a bivariate data set. y 37.5 76 33.2 76.1 42.8 79.3 36.4 94.3 52.1 93.3 61.9 106.5 15.2 45.6 23.3 57 15.1 54.1 13.7 42.5 75.9 145 This data can be downloaded as a *.csv file with this link: Download CSv Find the correlation coefficient and report it accurate to three decimal places. r= What proportion of the variation in y can be explained by the variation in the values of x? Report answer as a percentage accurate to one decimal place. R2 = %
Here is a bivariate data set. y 37.5 76 33.2 76.1 42.8 79.3 36.4 94.3 52.1 93.3 61.9 106.5 15.2 45.6 23.3 57 15.1 54.1 13.7 42.5 75.9 145 This data can be downloaded as a *.csv file with this link: Download CSv Find the correlation coefficient and report it accurate to three decimal places. r= What proportion of the variation in y can be explained by the variation in the values of x? Report answer as a percentage accurate to one decimal place. R2 = %

Glencoe Algebra 1, Student Edition, 9780079039897, 0079039898, 2018
18th Edition
ISBN:9780079039897
Author:Carter
Publisher:Carter
Chapter4: Equations Of Linear Functions
Section4.5: Correlation And Causation
Problem 2AGP

Related questions
Question
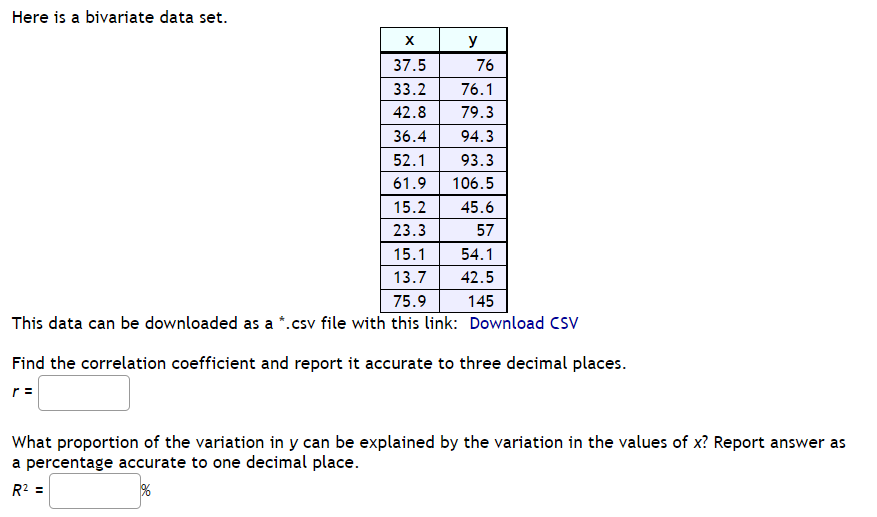
Transcribed Image Text:Here is a bivariate data set.
y
37.5
76
33.2
76.1
42.8
79.3
36.4
94.3
52.1
93.3
61.9
106.5
15.2
45.6
23.3
57
15.1
54.1
13.7
42.5
75.9
145
This data can be downloaded as a *.csv file with this link: Download CSv
Find the correlation coefficient and report it accurate to three decimal places.
r =
What proportion of the variation in y can be explained by the variation in the values of x? Report answer as
a percentage accurate to one decimal place.
R2 =
Expert Solution
This question has been solved!
Explore an expertly crafted, step-by-step solution for a thorough understanding of key concepts.

Step by step
Solved in 2 steps with 2 images

Recommended textbooks for you
Glencoe Algebra 1, Student Edition, 9780079039897…
Algebra
ISBN:
9780079039897
Author:
Carter
Publisher:
McGraw Hill
Glencoe Algebra 1, Student Edition, 9780079039897…
Algebra
ISBN:
9780079039897
Author:
Carter
Publisher:
McGraw Hill