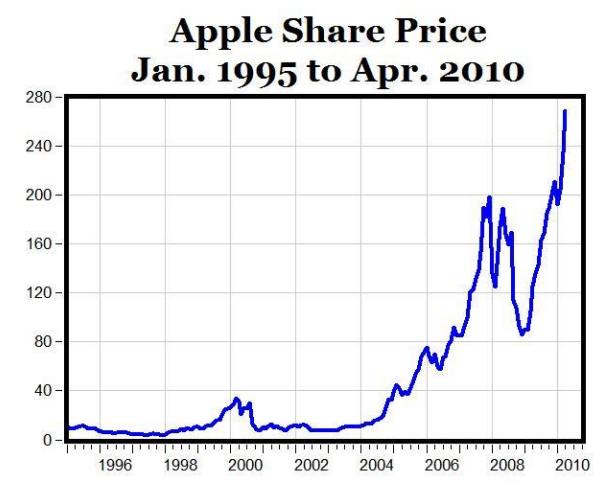
his chart is a technical analysis. What technical aspects does it study? As an investor what would you conclude from this chart?


Q: Dilowing repres an megal investor reporting practice?
A: Every company is required to maintain its financial records. There are various internal and external…
Q: Help me answer this question. Please provide two examples. Give two examples of where a vertical…
A: Vertical analysis is an accounting technique that makes it possible for records, such as financial…
Q: t is Institutional Investors? Briefly Explain.
A: There are many types of investors in the market and institutional investors are large investors.
Q: Within the context of services provided by a stockbroker, discuss the two main types of stockbrokers…
A: Stockbroker: A stockbroker is an authorized and directed money related firm that encourages…
Q: Explain the functions of financial markets in details and discuss lengthily how financial markets…
A: Financial markets means securities which are traded in the market. securities include bonds,…
Q: When it comes to the financial markets, how do you get started?
A: A financial market is a market in the economy where individuals and institutions trade financial…
Q: How would a researcher undertaking capital market research justify that a particular piece of…
A: The Capital Markets Research Group (CMRG) brings united researchers engaged in capital market…
Q: Within the context of services provided by a stockbroker, discuss the two (2) main types of…
A: Stockbrokers:- Brokers help investors in buying and selling securities, shares, and stocks of…
Q: Do you think that the so-called equity theories of accounting are really theories in the scientific…
A: Yes. equity theories of accounting are really theories in the scientific sense. the real owners are…
Q: How balance sheet makes? Give me some examples with solutions...??
A: Balance sheet is the detailed summary of the financial position of the company. It includes all…
Q: How do financial intermediaries help small investors access the market?
A: Financial Intermediaries: When two parties in a financial transaction engage in business with each…
Q: As an investor, would you rather invest on stock exchange with strict requirement or OTC market? And…
A: Listing on the stock exchange: A company that wishes to list on a stock exchange has to make several…
Q: What is the role of accounting in an efficient market? Is it worth investing the time and money…
A: The efficient-market hypothesis (EMH) is a hypothesis in financial economics that states that asset…
Q: How do earnings and cash are useful assets with future earnings potential? Does investors tend to…
A: Earnings and cash flows are two important aspects for a company. Earnings and positive cash flows…
Q: How can the Stock price be a good indicator of your company's financial health and may also reflect…
A: In order to examine the financial position of the company investor generally study and analyse the…
Q: Why do most academics and financial executives regard the NPV as being the single best criterion and…
A: NPV is better than IRR and is a single best criterion for capital budgeting decisions because this…
Q: Determine whether financial statement, the Balance Sheet or the Income Statement, is more essential…
A: These statements are meant to be read as a whole to give a complete view of a company's financial…
Q: Explain the lemons problem and why it is an important concern of investors.
A: Investments are the ways through which investors save their money by investing or keeping funds in…
Q: What are the benefits of investing in a company that Rocket Internet has launched?
A: Rocket Internet provides services to the business entity which ensures more qualitative performance…
Q: Which is one of the primary concerns of most businesspeople regarding the investments made in their…
A: Following are the primary concerns of most businesspeople regarding the investments made in their…
Q: Discuss what type of an investor you are. Support your answer
A: No two investors are alike and each investor invest in a manner best suited to his/her financial…
Q: Explain an accredited investors?
A: An accredited investor is a person or entity who is allowed to deal, trade and invest in financial…
Q: How would you describe the services provided by the investment advisory firms and portfolio…
A: Investment advisory firms and portfolio management companies are the important parts of investment…
Q: Describe some of the motives and mistakes made by the investors?
A: Investors are driven by different motives when taking decision to make investment in specific…
Q: Compare and contrast the individual investor and the institutional investor.
A: Individual investors and Institutional investors: In simple words, Individual investors are those…
Q: As an investor, why do you need to learj about time value of money, and how it will affect your…
A: An investor is a person who invests his or her time, energy, and money into a venture to earn profit…
Q: What does “PE” stand for in the PE ratio, and how do investors use this ratio?
A: Ratio Analysis: This refers to the performance measurement of the business, in order to know the…
Q: What should do as early as now, can develop the qualities of a financial advisory?
A: Introduction Financial Advisor You must do more than handle money to be a great financial advisor.…
Q: Suppose you have shares in a company that is listed on a stock exchange and you are considering…
A: Selling shares of a company is a vital decision which should be taken with utmost care and in…
Q: What are some very interesting and unique questions to ask an investment analyst in an informational…
A: Stocks, bonds, currencies, and commodities are among the assets that investment analysts collect…
Q: Explain Investor Suitability Standards?
A: Investor suitability standards are standards that are considered as benchmarks set for the investors…
Q: How would you describe yourself if you were a pre-investor type of investor?
A: Answer: Investors are the person who are involved in investment that can be active or passive…
Q: How you can explain that the stockholders are receiving an adequate return on their investment?…
A: Adequacy of return In simple words, return on equity can be defined as the amount of dividends that…
Q: Briefly discuss CAPM from the standpoint of investors and managers.
A: The Capital Asset Pricing Model (CAPM) is the financial model which shows the relationship between…
Q: Before investing, what are the factors you should take into considerations in order that your…
A: There are various factors that shall be taken into consideration which making investment decisions…
Q: How would a researcher undertaking capital markets research typically justify that a particular item…
A: A capital market researcher needs to make an analysis of the capital market for investment purpose.…
Q: hat is the contribution of fintech in developing a single financial market?
A: Fintech is the use of technology and computer and internet for the field of finance and banking and…
Q: What are some of the reasons why investors post IPOs into the primary markets?
A: An initial public offering occurs when a private firm sells its first shares of stock to the general…
Q: Why do you consider the relationship between the economy and the stock market an integral part of…
A: Economy and stock market movements are directly related. Stock markets reflect the economic…
Q: If you have the chance to invest in the stock market, what company will you invest in and why?…
A: Stock is the group of shares which is offered by the companies to arrange the money from the public.…
This chart is a technical analysis. What technical aspects does it study? As an investor what
would you conclude from this chart?

Step by step
Solved in 2 steps

- Price earning ratio: market price per common share/ earning per share 3388/ 42.64= 79.46 (2020 year) 1847/ 23.46= 78.77 (2019 year) Write financial analysis report.On July 5, 1994, SM Prime Holdings, Inc. (SMPH) had its IPO at P2.0669 per share. On July 5, 2019, the market value of SMPH was P38.25. Disregarding dividends, what is the ROI of an SMPH stock held for those 25 years? Choices: a. 17.51% b. 1850.60% c. 1750.60% d. 18.51%The following table reports (in millions) earnings, dividends, capital expenditures, and R&D for Intel for the period 1990–95: Capital YearNet IncomeDividendsExpendituresR&D1990$650$0$680$5171991819094861819921,067431,22878019932,295881,93397019942,2881002,4411,11119953,5661333,5501,296What are the dividend payout rates for Intel during these years? Is this payout policy consistent with the factors expected to drive dividend policy, as discussed in the chapter? What factors do you expect would lead Intel’s management to increase its dividend payout? How do you expect the stock market to react to such a decision?
- Ch12.3 Variour Inc recently completed its stock take and have provided you the below informationCategoryUnits inInventoryCost perunit NRV per unitWA1 85 $105.00 $100.00WB1 110 $80.00 $85.00WC1 135 $190.00 $195.00WD1 150 $45.00 $50.00WE1 165 $200.00 $190.00Required:Calculate the total value of Kentex' closing InventoryFinancial information for Forever 18 includes the following selected data:($ in millions) 2021 2020Net income $ 129 $ 308Dividends on preferred stock $ 20 $ 15Average shares outstanding 150 400Stock price $ 12.02 $ 10.97Required:1. Calculate earnings per share in 2020 and 2021. Did earnings per share increase in 2021?2. Calculate the price-earnings ratio in 2020 and 2021. In which year is the stock priced lower in relation to reported earnings?PROVIDE COMPUTATIONS!!! 10. What is the book value of the preference shares on December 31, 2018?a. P105 c. P100b. P110 d. P11511. What is the book value of the ordinary shares on December31 2018?a. P13.40 c. P14.15b. P14.52 d. P13.78
- Preferred shares: P14,560 Goodwill: P1,728,000 Preferred shares: P17,280 Goodwill: P576,000 Preferred shares: P11,520 Goodwill: P576,000 Preferred shares: P5,760 Goodwill: P1,728,000 *correction: investment fmv is referring to inventoryA leading AI technology firm ATOOL, is publicly traded on the US stock market with shares currently valued at $15 each. Some information from its annual report of Year 2023, is presented in the following tables (Unit=’1000). Income Statement (2023)Sales $21,800Cost of goods sold $15,050Depreciation $4,150EBIT $2,600Interest $1,830Taxable income $870Taxes (34%) 296Net income $574 Balance Sheet 2022 2023Current assets $3,800 $6,930Net fixed assets $23,650 $26,800Current liabilities $2,700 $3,150 Compute the cash flow from assets (CFFA) of ATOOL for the year 2023 and show how you interpret the number you get for CFFA.A leading AI technology firm ATOOL, is publicly traded on the US stock market with shares currently valued at $15 each. Some information from its annual report of Year 2023, is presented in the following tables (Unit=’1000). Income Statement (2023)Sales $21,800Cost of goods sold $15,050Depreciation $4,150EBIT $2,600Interest $1,830Taxable income $870Taxes (34%) 296Net income $574 Balance Sheet 2022 2023Current assets $3,800 $6,930Net fixed assets $23,650 $26,800Current liabilities $2,700 $3,150 In a noteworthy turn of events, Elon Musk, a renowned billionaire, has expressed keen interest in acquiring all outstanding shares of ATOOL at an attractive price of $30 per share. Despite the enticing offer, the management team has promptly declined Musk's proposal, opting instead to deploy a series of strategic measures aimed at foiling the acquisition bid. Discuss whether the management team is acting in the…
- The following amounts were taken from the financial statements of Bramble Company: 2020 2019 Total assets $840000 $1020000 Net sales 770000 640000 Gross profit 353000 350000 Net income 200000 111000 Weighted average number of common shares outstanding 40000 88000 Market price of common stock $145.00 $36.00 The price-earnings ratio for 2020 is 5.00 times. 7.53 times. 31.00 times. 29.00 times.INCOME STATEMENT Year ended June 30 2022 2021 $'000 $'000Revenue 22450 18675Cost of sales 8475 8055Gross Profit 13975 10620Distribution costs 4245 3120Administrative expenses 1276 2134Selling expenses…BE4.8 In 2020, Jollis corporation reported net income of $1000000. it declared and paid perferred stock dividends of $250000. During 2020, Hollis had weighted average of 190000 common shares outstanding. Compute Hollis's 2020 earnings per share.