
Algebra & Trigonometry with Analytic Geometry
13th Edition
ISBN:9781133382119
Author:Swokowski
Publisher:Swokowski
Chapter3: Functions And Graphs
Section3.3: Lines
Problem 27E

Related questions
Question
Transcribed Image Text:711 @
e l.:0r
* Asiacell l.
Tangenet and Normal Lines.pdf
How
norma1
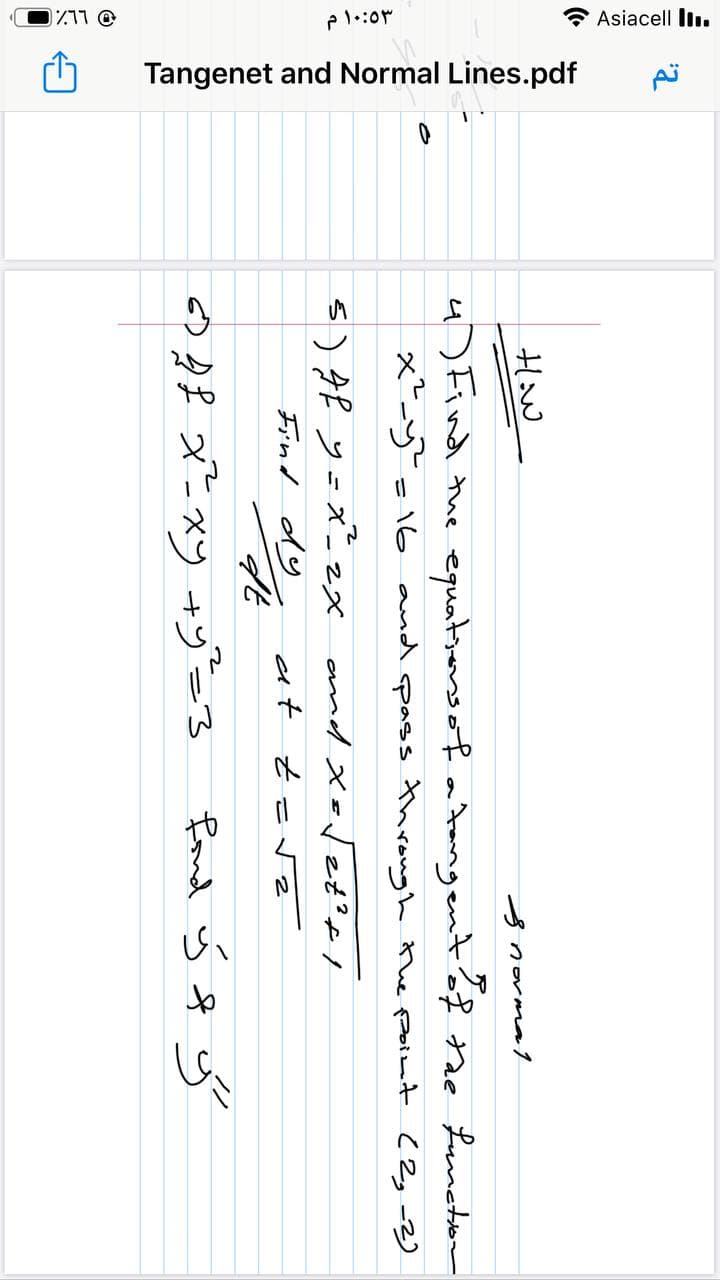
4) Find the equatsers of a Aangentaf the Luneton
xy=16 and pass through the point (2g -2)
%3D
5) gf y=x 2x amdxoTet?fI
Find dy
at t
○4f メニxy +ン-3
fond ý f y
Expert Solution
This question has been solved!
Explore an expertly crafted, step-by-step solution for a thorough understanding of key concepts.

Step by step
Solved in 2 steps

Knowledge Booster


Learn more about
Need a deep-dive on the concept behind this application? Look no further. Learn more about this topic, calculus and related others by exploring similar questions and additional content below.Recommended textbooks for you
Algebra & Trigonometry with Analytic Geometry
Algebra
ISBN:
9781133382119
Author:
Swokowski
Publisher:
Cengage
Algebra & Trigonometry with Analytic Geometry
Algebra
ISBN:
9781133382119
Author:
Swokowski
Publisher:
Cengage