How to make a graph? 1. Collect your data. After you have it all in one place, you should have one independent variable (like time) and one dependent variable (like something you measure as a function of time). Here are some points we will use as an example; we've measured position of a ball (dependent variable) as a function of time (independent variable):
How to make a graph? 1. Collect your data. After you have it all in one place, you should have one independent variable (like time) and one dependent variable (like something you measure as a function of time). Here are some points we will use as an example; we've measured position of a ball (dependent variable) as a function of time (independent variable):

Related questions
Question
How to make a graph?
1. Collect your data.
After you have it all in one place, you should have one independent variable (like time)
and one dependent variable (like something you measure as a function of time). Here
are some points we will use as an example; we've measured position of a ball
(dependent variable) as a function of time (independent variable):
Transcribed Image Text:+ lap2 Gi G
> 13.90 G W b! 1o i Juaoi O Answe b Applica G
الملفات
The po G
Anti-Ce
X Exp Bb
PowerF
Bb
Conter
Bb
R
rafid.bu.edu.sa/bbcswebdav/pid-1551211-dt-content-rid-26486965_1/courses/PHYS10001_12672144310/Experiment%202.pdf A
قائمة القراءة
2 واتساب
web_design_conce.. 6
Colour Vocabulary -.
H الكلاس و الكائن في ج. . .
TechCampus - .oLio 6
ترجمة على الانترنت. . . .
Microsoft - One Mil...
+
100%
1 / 2
Experiment 2.pdf
Purpose of the experiment:
Ability to draw a curve using experimental data.
How to make a graph?
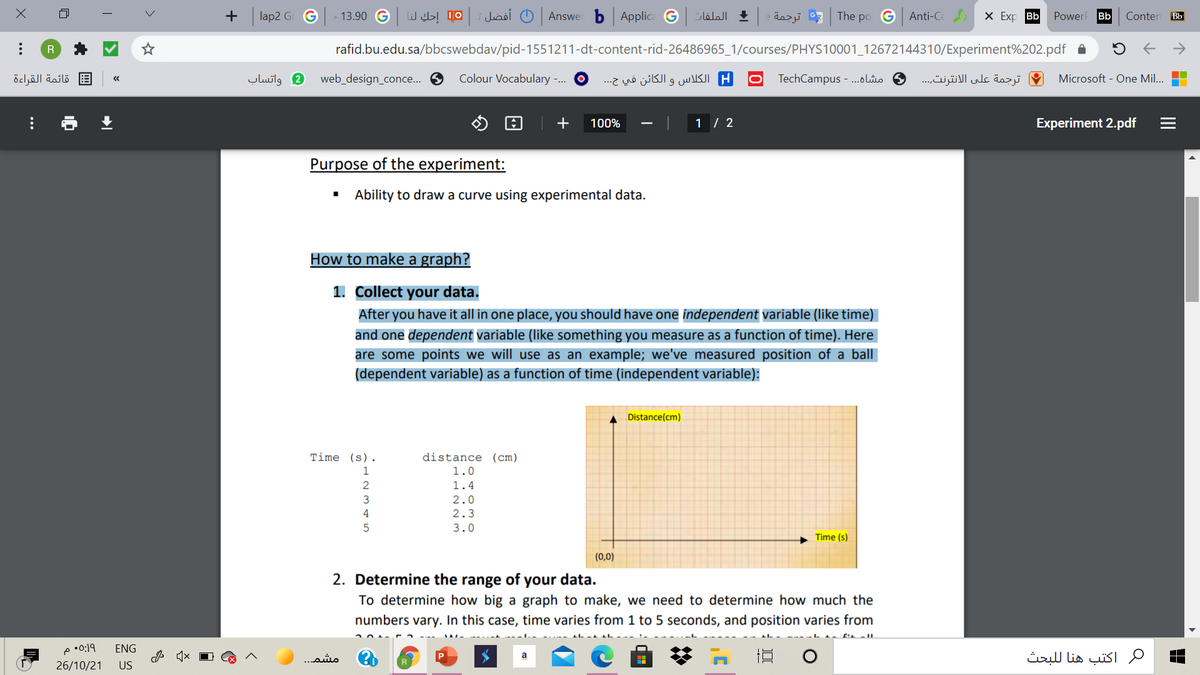
1. Collect your data.
After you have it all in one place, you should have one independent variable (like time)
and one dependent variable (Ilike something you measure as a function of time). Here
are some points we will use as an example; we've measured position of a ball
(dependent variable) as a function of time (independent variable):
Distance(cm)
Time (s).
distance (cm)
1
1.0
1.4
2.0
2.3
4
3.0
Time (s)
(0,0)
2. Determine the range of your data.
To determine how big a graph to make, we need to determine how much the
numbers vary. In this case, time varies from 1 to 5 seconds, and position varies from
p•0:19
ENG
مشم. .
R
P
اكتب هنا ل لبحث
26/10/21
US
II
Expert Solution
This question has been solved!
Explore an expertly crafted, step-by-step solution for a thorough understanding of key concepts.

Step by step
Solved in 2 steps with 1 images
