How would each of the bar charts in picture below (in part A) be different IF EARTH WERE NOT PART OF THE SYSTEM? I understand the bar charts below - I need to know how they would be different IF EARTH WERE NOT PART OF THE SYSTEM. Thanks
How would each of the bar charts in picture below (in part A) be different IF EARTH WERE NOT PART OF THE SYSTEM? I understand the bar charts below - I need to know how they would be different IF EARTH WERE NOT PART OF THE SYSTEM. Thanks

Related questions
Question
How would each of the bar charts in picture below (in part A) be different IF EARTH WERE NOT PART OF THE SYSTEM?
I understand the bar charts below - I need to know how they would be different IF EARTH WERE NOT PART OF THE SYSTEM.
Thanks
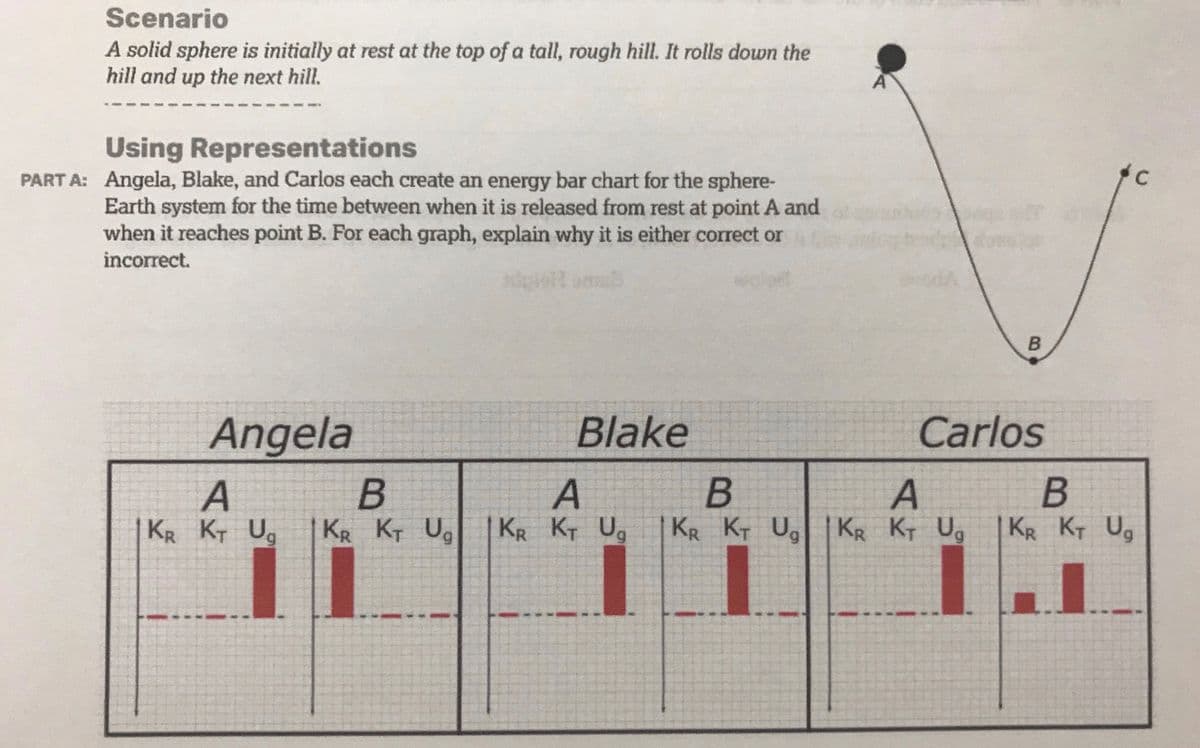
Transcribed Image Text:Scenario
A solid sphere is initially at rest at the top of a tall, rough hill. It rolls down the
hill and up the next hill.
Using Representations
PART A: Angela, Blake, and Carlos each create an energy bar chart for the sphere-
Earth system for the time between when it is released from rest at point A and
when it reaches point B. For each graph, explain why it is either correct or
incorrect.
od/
Angela
Blake
Carlos
А
KR KT Ug
A
KR KT U KR KT Ug
KR KT Ug
KR KT Ug
KR KT Ug
Expert Solution
This question has been solved!
Explore an expertly crafted, step-by-step solution for a thorough understanding of key concepts.

This is a popular solution!

Trending now
This is a popular solution!

Step by step
Solved in 5 steps
