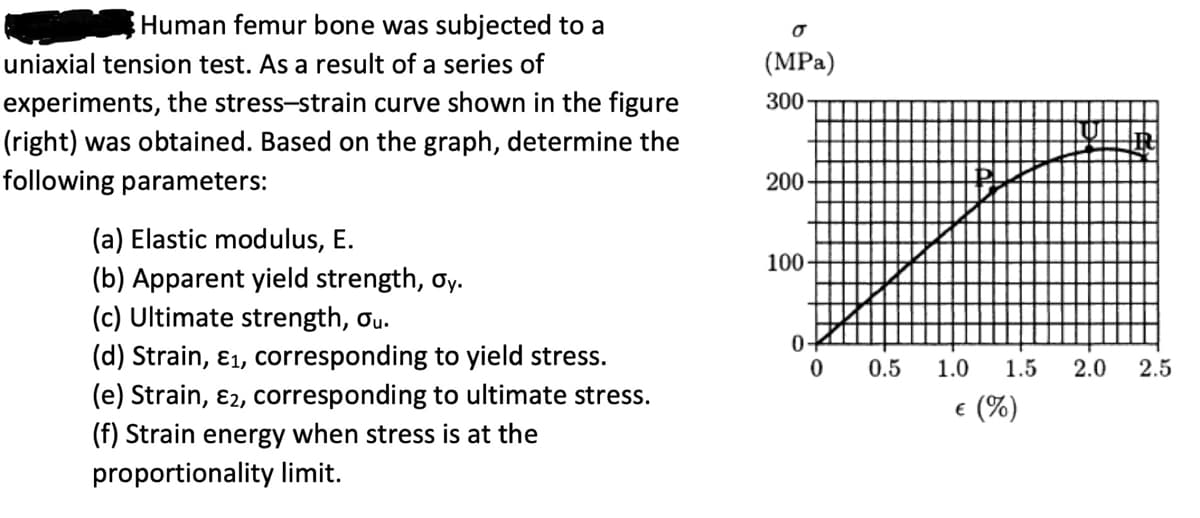
Human femur bone was subjected to a uniaxial tension test. As a result of a series of experiments, the stress-strain curve shown in the figure (right) was obtained. Based on the graph, determine the following parameters: (a) Elastic modulus, E. (b) Apparent yield strength, oy. (c) Ultimate strength, ou. (d) Strain, E1, corresponding to yield stress. (e) Strain, ε2, corresponding to ultimate stress. (f) Strain energy when stress is at the proportionality limit. σ (MPa) 300 200 100. 0 0 0.5 1.0 1.5 2.0 2.5 € (%)
Human femur bone was subjected to a uniaxial tension test. As a result of a series of experiments, the stress-strain curve shown in the figure (right) was obtained. Based on the graph, determine the following parameters: (a) Elastic modulus, E. (b) Apparent yield strength, oy. (c) Ultimate strength, ou. (d) Strain, E1, corresponding to yield stress. (e) Strain, ε2, corresponding to ultimate stress. (f) Strain energy when stress is at the proportionality limit. σ (MPa) 300 200 100. 0 0 0.5 1.0 1.5 2.0 2.5 € (%)

Related questions
Question
Transcribed Image Text:Human femur bone was subjected to a
uniaxial tension test. As a result of a series of
experiments, the stress-strain curve shown in the figure
(right) was obtained. Based on the graph, determine the
following parameters:
(a) Elastic modulus, E.
(b) Apparent yield strength, oy.
(c) Ultimate strength, ou.
(d) Strain, E1, corresponding to yield stress.
(e) Strain, ε2, corresponding to ultimate stress.
(f) Strain energy when stress is at the
proportionality limit.
σ
(MPa)
300
200
100.
0
0
0.5
1.0
1.5
2.0
2.5
€ (%)
Expert Solution
This question has been solved!
Explore an expertly crafted, step-by-step solution for a thorough understanding of key concepts.

Step by step
Solved in 2 steps
