I don’t understand the concept of Mendels formula. I don’t get how they used the ratios in table 3.4 to predict the number of genotypes in each generation and I was wondering if you could explain it better. I don’t know how they got those numbers.
I don’t understand the concept of Mendels formula. I don’t get how they used the ratios in table 3.4 to predict the number of genotypes in each generation and I was wondering if you could explain it better. I don’t know how they got those numbers.

Biology: The Dynamic Science (MindTap Course List)
4th Edition
ISBN:9781305389892
Author:Peter J. Russell, Paul E. Hertz, Beverly McMillan
Publisher:Peter J. Russell, Paul E. Hertz, Beverly McMillan
Chapter18: Dna Technologies: Making And Using Genetically Altered Organisms, And Other Applications
Section: Chapter Questions
Problem 10TYK

Related questions
Question
I don’t understand the concept of Mendels formula. I don’t get how they used the ratios in table 3.4 to predict the number of genotypes in each generation and I was wondering if you could explain it better. I don’t know how they got those numbers.
Transcribed Image Text:4:12 PM Thu Sep 9
* 63%
Library
Fundamentals of Biology I - CBEN110 - Beeler, Farnsworth, Shaffer - Fall.
probability that allow you to predict the outcomes of genetic experiments.
Tool for calculating probabilities
Mendel used symbols and mathematics to represent a complex biological process that he did not understand
at the molecular level. Based on your modern knowledge, you can understand the mechanism shown in
Figure 3.7. On average, every time a heterozygote is self-pollinated, it produces 25% homozygous dominant
peas, 50% heterozygous peas, and 25% homozygous recessive peas. A visual tool called a Punnett square in
Figure 3.8 is helpful for calculating ratios of progeny based on gamete genotypes. For simplicity, it is easier
to assume that each cross produces four peas, although four is just a number used for convenience. A
Punnett square lists all of the possible gamete genotypes on the outside of the square (top and left), letting
you simply combine all the columns and rows to produce the progeny genotypes inside the square. You can
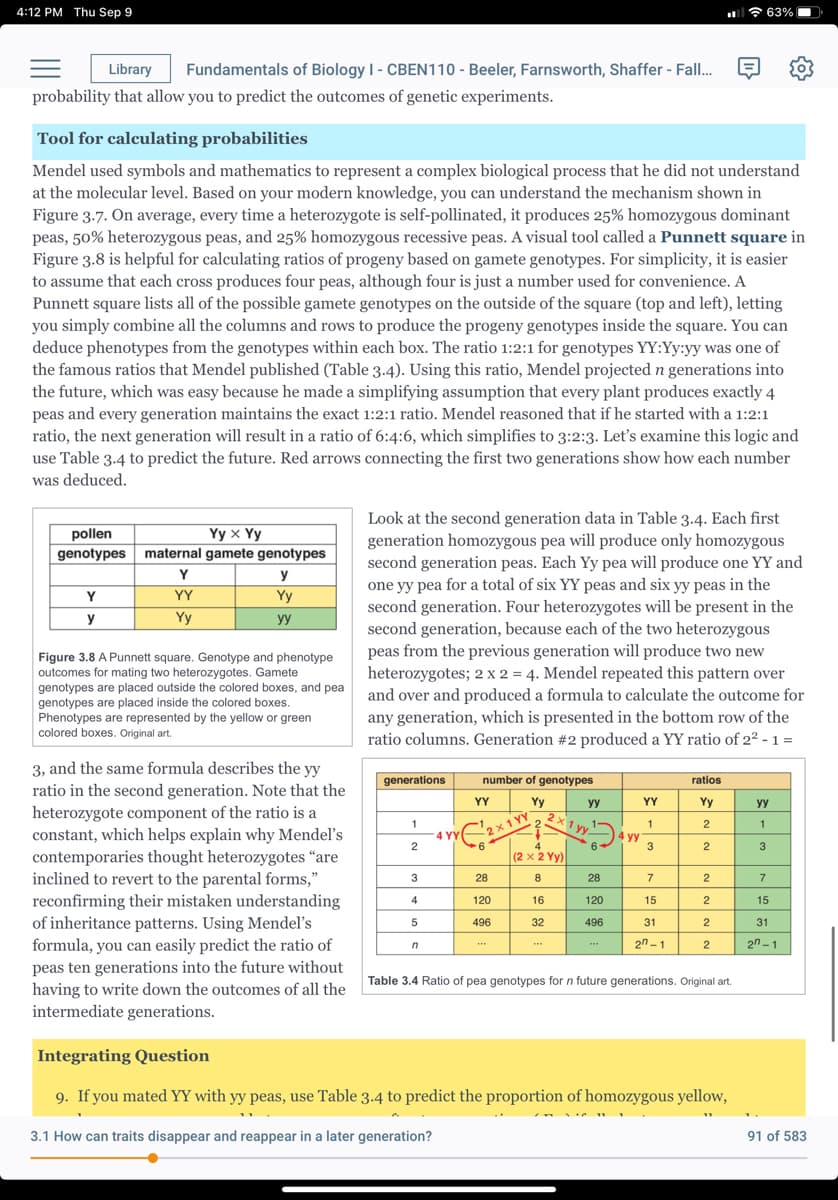
deduce phenotypes from the genotypes within each box. The ratio 1:2:1 for genotypes YY:Yy:yy was one of
the famous ratios that Mendel published (Table 3.4). Using this ratio, Mendel projected n generations into
the future, which was easy because he made a simplifying assumption that every plant produces exactly 4
peas and every generation maintains the exact 1:2:1 ratio. Mendel reasoned that if he started with a 1:2:1
ratio, the next generation will result in a ratio of 6:4:6, which simplifies to 3:2:3. Let's examine this logic and
use Table 3.4 to predict the future. Red arrows connecting the first two generations show how each number
was deduced.
Look at the second generation data in Table 3.4. Each first
generation homozygous pea will produce only homozygous
pollen
Yy × Yy
maternal gamete genotypes
genotypes
second generation peas. Each Yy pea will produce one YY and
one yy pea for a total of six YY peas and six yy peas in the
second generation. Four heterozygotes will be present in the
second generation, because each of the two heterozygous
peas from the previous generation will produce two new
heterozygotes; 2 x 2 = 4. Mendel repeated this pattern over
and over and produced a formula to calculate the outcome for
Y
y
Y
YY
Yy
y
Yy
yy
Figure 3.8 A Punnett square. Genotype and phenotype
outcomes for mating two heterozygotes. Gamete
genotypes are placed outside the colored boxes, and pea
genotypes are placed inside the colored boxes.
Phenotypes are represented by the yellow or green
colored boxes. Original art.
any generation, which is presented in the bottom row of the
ratio columns. Generation #2 produced a YY ratio of 22 - 1 =
3, and the same formula describes the yy
generations
number of genotypes
ratios
ratio in the second generation. Note that the
YY
Yy
yy
YY
Yy
yy
heterozygote component of the ratio is a
constant, which helps explain why Mendel's
contemporaries thought heterozygotes “are
inclined to revert to the parental forms,"
reconfirming their mistaken understanding
of inheritance patterns. Using Mendel's
formula, you can easily predict the ratio of
2x1 YY
4
(2 x 2 Yy)
х1 у.
1
4 YY
1
2
1
yy
3
9-
2
3
3
28
8
28
4
120
16
120
15
2
15
496
32
496
31
31
2n-1
2n -1
...
***
peas ten generations into the future without
having to write down the outcomes of all the
intermediate generations.
Table 3.4 Ratio of pea genotypes for n future generations. Original art.
Integrating Question
9. If you mated YY with yy peas, use Table 3.4 to predict the proportion of homozygous yellow,
3.1 How can traits disappear and reappear in a later generation?
91 of 583
Expert Solution
This question has been solved!
Explore an expertly crafted, step-by-step solution for a thorough understanding of key concepts.

Step by step
Solved in 3 steps

Recommended textbooks for you
Biology: The Dynamic Science (MindTap Course List)
Biology
ISBN:
9781305389892
Author:
Peter J. Russell, Paul E. Hertz, Beverly McMillan
Publisher:
Cengage Learning

Biology 2e
Biology
ISBN:
9781947172517
Author:
Matthew Douglas, Jung Choi, Mary Ann Clark
Publisher:
OpenStax

Biology: The Unity and Diversity of Life (MindTap…
Biology
ISBN:
9781305073951
Author:
Cecie Starr, Ralph Taggart, Christine Evers, Lisa Starr
Publisher:
Cengage Learning
Biology: The Dynamic Science (MindTap Course List)
Biology
ISBN:
9781305389892
Author:
Peter J. Russell, Paul E. Hertz, Beverly McMillan
Publisher:
Cengage Learning
Biology 2e
Biology
ISBN:
9781947172517
Author:
Matthew Douglas, Jung Choi, Mary Ann Clark
Publisher:
OpenStax
Biology: The Unity and Diversity of Life (MindTap…
Biology
ISBN:
9781305073951
Author:
Cecie Starr, Ralph Taggart, Christine Evers, Lisa Starr
Publisher:
Cengage Learning