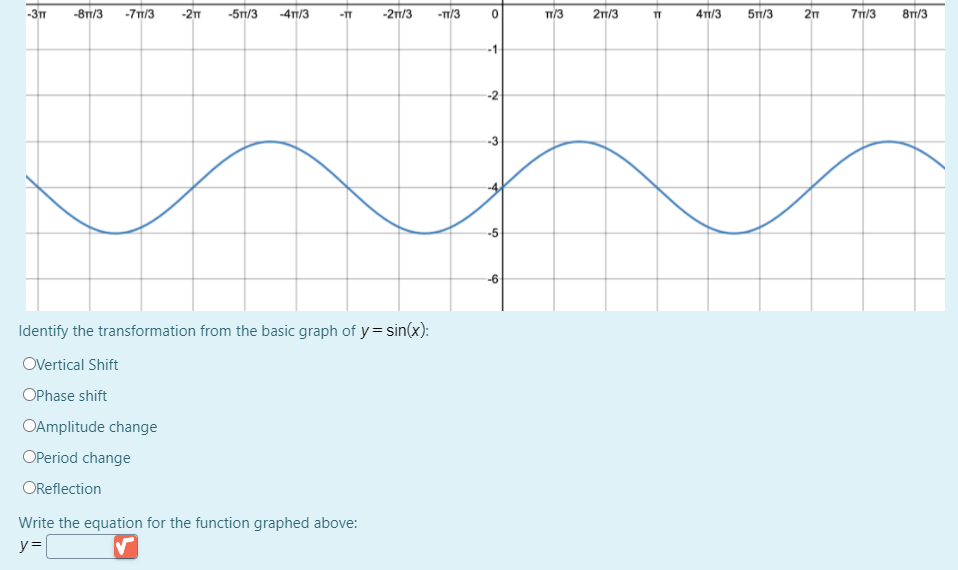
Identify the transformation from the basic graph of y = sin(x): OVertical Shift OPhase shift OAmplitude change OPeriod change OReflection Write the equation for the function graphed above: y= |


Q: Outside temperature over a day can be modelled as a sinusoidal function. Suppose you know the high…
A: Given data: The high temperature for the day is TH=92 degrees. The low temperature for the day is…
Q: The graph below shows the function y= sin(x) with several transformations. -8 -3T |-2 -TT 2 TT…
A: Amplitude is the maximum height from its mean position. As its mean position is at 3 units in…
Q: consider the function y=−3sin(4x−π/2)+1 a) What is the amplitude? b) What is the period? c)…
A: The trigonometric transformation of the cosine function is y=AcosBx+C+D and the sine function is…
Q: Sketch the graph of the function. y = tan 2x
A:
Q: Outside temperature over a day can be modelled as a sinusoidal function. Suppose you know the…
A: Given that outside temperature over a day can be modeled as a sinusoidal function. Suppose you know…
Q: Use a vertical shift to graph the function. y= cos x+8 Use the graphing tool to graph the function.
A:
Q: Sketch the graph of the function: (Write on the graph the scale on both x-axes and y-axes) a. Y = 3…
A:
Q: Is the graph shown below that of a function? sin x 0+ -7 -6 -5 -4 -3 -2 -1 1 2 3. 4 5 6 7 Answer:…
A:
Q: (d) Describe the transformations and sketch the graph of f(x) = 2 – sin (x +)
A:
Q: Graph the function by hand, not by plotting points, butby starting with the graph of one of the…
A: Consider the given expression is, y=14tanx-π4 The graph for the above equation is obtained by first…
Q: Q30) Use shifting graph to sketch a) y = b) y = -4 + sin (2x)
A: a) Given: y=1x2-2 This is in the form of g(x)=f(x)+k where f(x)=1x2 , k=-2…
Q: For the problem below, identify the amplitude, period, horizontal shift (phase shift), and vertical…
A: Given:
Q: Consider the function y = -4 cos 2x -2. 3 a) Describe the vertical translation. b) Graph the…
A:
Q: Find the amplitude, period, and horizontal shift of the function. v -- sin(x - 4) amplitude period…
A: Given function y=-3 sinx-π4
Q: The graphs below show the first and second derivatives of a function y = f(x). Select a possible…
A: To determine the graph of the function.
Q: Sketch the graph and give its properties for each of the following functions. y = tan 2x 3.
A: Here we have to sketch the graph of y = 12tan2x ...................................... (1)
Q: For the function y = -3 cos (x + 3) – 1 Describe all properties and sketch a graph.
A: Solution Question 1 Given, The function y = -3cosπ2x+3-1 We have to describe all the properties…
Q: Sketch the graphs of the following function * y = tan(x)
A: Solution:-
Q: The graph of y= sin(x) shifts T units to the left and units upward. Which of the following functions…
A:
Q: Outside temperature over a day can be modeled as a sinusoidal function. Suppose you know the high…
A: The equation of a sinusoidal function of amplitude A, phase difference C, vertical shift D, time…
Q: Determine whether the following statement is true or false. The graph of y= cos 2x + has phase shift…
A: The general equation of sinusoidal and cosine function is: y =A sin (B(x-C)) + D And, y = A…
Q: Identify the transformation from the basic graph of y = sin(x): OVertical Shift OPhase shift OPeriod…
A: NOTE: Refresh your page if you can't see any equations. . the period of the basic sine function is…
Q: snip
A: Given- y=cosx-π2-1 To Use- Transformation to graph the above equation.
Q: IV. Find the period and horizontal shift of the function and graph one complete period: a) y =…
A:
Q: Outside temperature over a day can be modelled as a sinusoidal function. Suppose you know the high…
A:
Q: The average monthly temperature, y, in degrees Fahrenheit, for Juneau, Alaska, can be modeled by y =…
A: The average monthly temperature y, in degrees Fahrenheit for Juneau, Alaska, can be modeled by…
Q: Determine the amplitude, period, and phase shift for y-tan(6+ 30) and use them to plot the graph of…
A: Note that the given trigonometric function can be written as: y=a tan(bθ+c)...(1) where a is the…
Q: 1 tan(4x – T) - 2 Y = 2 Graph the function. Type your final table for y below. Y
A:
Q: 1. Draw a graph of position y as a function of time t. 2. Assume a relationship of the form: y = at"…
A: Given, t = Time in seconds y = position of falling object (meters) t(s) y(m) 0.42 0.88 0.56…
Q: What is the transformation for this function I can't figure out the period y=-cos(3(x+180))-1
A: Use the form a cos(bx-c)+d where, a is amplitude, 2πb is the period, -cb is a horizontal shift and d…
Q: Outside temperature over a day can be modelled as a sinusoidal function. Suppose you know the high…
A:
Q: Graph the function by hand, not by plotting points, butby starting with the graph of one of the…
A: For plotting the function, first plot the graph of the function y=sinx.
Q: Which of the functions below represents the graph below? a) y = - cos(2x) b) y = cos(2x) c) y = -…
A:
Q: Outside temperature over a day can be modelled as a sinusoidal function. Suppose you know the high…
A: Max = 60 min= 40 So amplitude = a = (60-40)/2= 10 Mid line= d= (60+40)/2=50 period= 24 hours So,…
Q: Application - Social Media A vlogger receives a notification each day of how many views their vlog…
A:
Q: Outside temperature over a day can be modelled as a sinusoidal function. Suppose you know the high…
A:
Q: Outside temperature over a day can be modelled as a sinusoidal function. Suppose you know the high…
A: Given that the highest temperature for the day is 77 degrees and the lowest temperature is 63…
Q: c) With respect to y = cosx, the horizontal shift of the function is d) With respect to y = cosx,…
A:
Q: Determine what geometric transformation is needed to obtain the graph of the second function from…
A: Solution is given below:
Q: Use addition of y-coordinates to sketch the graph of the function between x=0 and x=4π Hint: Work…
A: The function we have to sketch the graph of is y=1-sinx. In order to do that, 1st sketch the graph…
Q: C. Sketch the graph of each function over two periods, starting from x = 0. Indicate the period,…
A: Note- Since multiple questions are asked, I am solving first question with both sub parts . Please…
Q: Outside temperature over a day can be modelled as a sinusoidal function. Suppose you know the high…
A:
Q: Vhich graph represents the graph of the function, f (x) = 4 cos 0 ?
A:
Q: outside temperature over a day can be modelled as a sinusoidal function. Suppose you know the high…
A: Given Data The high temperature is Ta=89 degrees. The low temperature is Tb=71 degrees. The…
Q: Identify the range of the graph of y = 1 + sin x.
A: Solution is given below..
Q: Consider the function y= −3sin (4x- Pi/2) + 1 a) What is the amplitude? b) What is the period?…
A: We know that if the sine function is y=AsinBx+C+D. Amplitude is A. Period is 2πB. Phase shift is C.…
Q: For the following sinusoidal function, state the transformations in words, and determine the…
A: Given data :- f(θ)=-2sin[13(θ+π4)]+5
Q: onsider the function y=−3sin(4x−π/2)+1 a) What is the amplitude? b) What is the period? c)…
A: Given: y=−3sin4x−π2+1
Q: 4. Sketch the graph of the basic function y-sinx and y--Isin (2(x +90))+2 State the following: a.…
A:

Step by step
Solved in 3 steps with 1 images

- A perfectly – mixed stirred – tank reactor of a constant volume V is having a tracer study done. Prior to the start of the study, the concentration of tracer is zero in the reactor and in the feed stream. At time = 0, Nt moles of tracer is instantaneously charged to the reactor, resulting in an initial tracer concentration of xo. Find the concentration of tracer, x(t) given a reactor volume of V and a flow rate in and out of q using Laplace TransformsSuppose a linear transformation: T:R2-->R2 is formed by taking a rotation counterclockwise of 180 degrees, followed by a reflection across the x2-axis. Describe the points that will be moved back to their original position by this transformation.A pre-image of a figure contains the point (3, 4). Distinguish the location of this point in the image of the transformation (x, y) → (y, x) by plotting your original point and your transformed point on a coordinate plane.
- The point P(a, b) in the XY-plane is first rotated counterclockwise by 90 degrees around the point (1, 5) and then reflected about the line y= -x. The image of P after these two transformations is at (-6, 3). What is b - a,?I want ONLY the transformations for thisExplain the effects of changes in “a” and “c” on the graph of y = ax2 + c. Transformations – Reflections (across the x-axis), vertical translations, and vertical dilations
- A nonrigid transformation of the graph of y=f(x) represented by g(x)= cf(x) is a _____ when c>1 and a _____ when 0Find Singular Value Decomposition of | 3 2 | | 2 3 | | 2 -2 |A pre-image of a figure contains the point (10, 3). Distinguish the location of this point in the image of the transformation (x, y) -> (x - 11, y+ 6) by plotting your original point and your transformed point on a coordinate plane.
- Find range R(T) of linear transformation T(x1,x2,x3)=(x1-x2,x1+x3)The rationalizing substitution y=u6 transforms in the picture into.If x(t) <---> X(f) and y(t) <---> Y(f), using the Fourier table and Fourier transform pairs, determine the Fourier transform of the following expressions. Identify and list the properties that you have used in the solution. Hint: You are not supposed to solve manually.