If the claim in part (c) is tested using this sample data, we get this confidence interval: -0.000483 < p1 -p 2< - 0.000324 What does this confidence interval suggest about the claim?
If the claim in part (c) is tested using this sample data, we get this confidence interval: -0.000483 < p1 -p 2< - 0.000324 What does this confidence interval suggest about the claim?

Glencoe Algebra 1, Student Edition, 9780079039897, 0079039898, 2018
18th Edition
ISBN:9780079039897
Author:Carter
Publisher:Carter
Chapter10: Statistics
Section10.4: Distributions Of Data
Problem 19PFA

Related questions

Question
If the claim in part (c) is tested using this sample data, we get this confidence interval: -0.000483 < p1 -p 2< - 0.000324
What does this confidence interval suggest about the claim?
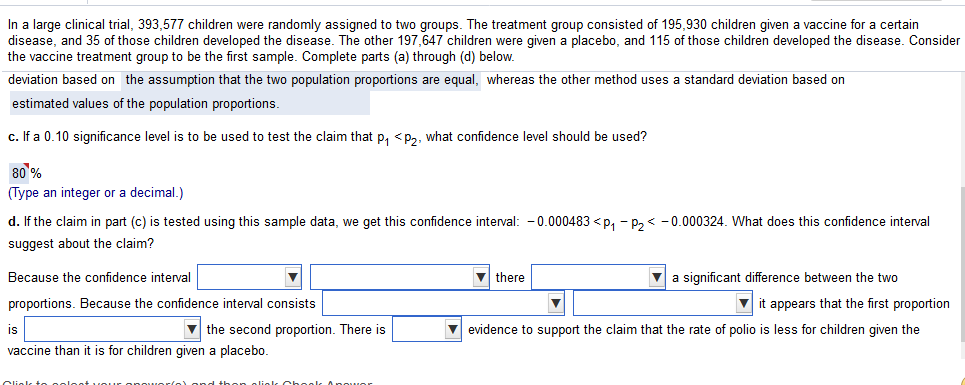
Transcribed Image Text:In a large clinical trial, 393,577 children were randomly assigned to two groups. The treatment group consisted of 195,930 children given a vaccine for a certain
disease, and 35 of those children developed the disease. The other 197,647 children were given a placebo, and 115 of those children developed the disease. Consider
the vaccine treatment group to be the first sample. Complete parts (a) through (d) below.
deviation based on the assumption that the two population proportions are equal, whereas the other method uses a standard deviation based on
estimated values of the population proportions.
c. If a 0.10 significance level is to be used to test the claim that p, <p,, what confidence level should be used?
80'%
(Type an integer or a decimal.)
d. If the claim in part (c) is tested using this sample data, we get this confidence interval: -0.000483 <p, - p, < - 0.000324. What does this confidence interval
suggest about the claim?
Because the confidence interval
there
a significant difference between the two
proportions. Because the confidence interval consists
it appears that the first proportion
is
V the second proportion. There is
evidence to support the claim that the rate of polio is less for children given the
vaccine than it is for children given a placebo.
Cliolk t
Expert Solution
This question has been solved!
Explore an expertly crafted, step-by-step solution for a thorough understanding of key concepts.

This is a popular solution!

Trending now
This is a popular solution!

Step by step
Solved in 2 steps

Knowledge Booster


Learn more about
Need a deep-dive on the concept behind this application? Look no further. Learn more about this topic, probability and related others by exploring similar questions and additional content below.Recommended textbooks for you
Glencoe Algebra 1, Student Edition, 9780079039897…
Algebra
ISBN:
9780079039897
Author:
Carter
Publisher:
McGraw Hill
Glencoe Algebra 1, Student Edition, 9780079039897…
Algebra
ISBN:
9780079039897
Author:
Carter
Publisher:
McGraw Hill