If the growth rate showed a constant increase from 150 animals per year in 2015 to 285 animals per year in 2020, with t time, in years, since 2015, 4.1 Graph the function G = f(t) on the given set of axes.
If the growth rate showed a constant increase from 150 animals per year in 2015 to 285 animals per year in 2020, with t time, in years, since 2015, 4.1 Graph the function G = f(t) on the given set of axes.

College Algebra
7th Edition
ISBN:9781305115545
Author:James Stewart, Lothar Redlin, Saleem Watson
Publisher:James Stewart, Lothar Redlin, Saleem Watson
Chapter4: Exponential And Logarithmic Functions
Section: Chapter Questions
Problem 101E: Radioactive Decay The half-life of radium-226 is 1590 years. (a)If a sample has a mass of 150 mg,...

Related questions

Topic Video
Question

Transcribed Image Text:4.3 (b) Represent the increase in the animal population from 2015 to 2020 as a definite integral of f.
Show how you use the antiderivative and the fundamental theorem to calculate the definite integral.
Transcribed Image Text:Question 4
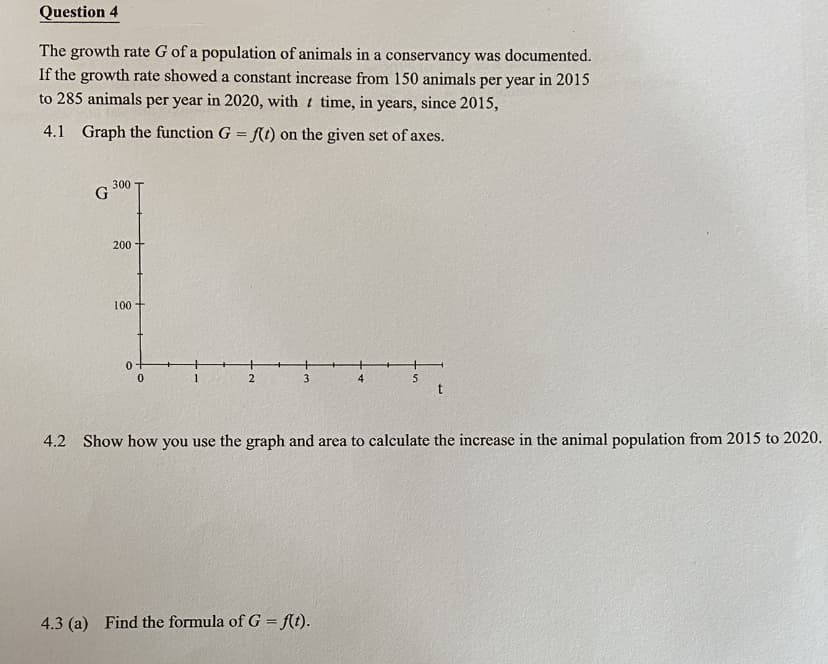
The growth rate G of a population of animals in a conservancy was documented.
If the growth rate showed a constant increase from 150 animals per year in 2015
to 285 animals per year in 2020, with t time, in years, since 2015,
4.1
Graph the function G = f(t) on the given set of axes.
300
G
200
100 +
1
2
3
4
4.2 Show how you use the graph and area to calculate the increase in the animal population from 2015 to 2020.
4.3 (a) Find the formula of G = f(t).
Expert Solution
This question has been solved!
Explore an expertly crafted, step-by-step solution for a thorough understanding of key concepts.

Step by step
Solved in 3 steps with 3 images

Knowledge Booster


Learn more about
Need a deep-dive on the concept behind this application? Look no further. Learn more about this topic, calculus and related others by exploring similar questions and additional content below.Recommended textbooks for you
College Algebra
Algebra
ISBN:
9781305115545
Author:
James Stewart, Lothar Redlin, Saleem Watson
Publisher:
Cengage Learning

Algebra and Trigonometry (MindTap Course List)
Algebra
ISBN:
9781305071742
Author:
James Stewart, Lothar Redlin, Saleem Watson
Publisher:
Cengage Learning

Algebra & Trigonometry with Analytic Geometry
Algebra
ISBN:
9781133382119
Author:
Swokowski
Publisher:
Cengage
College Algebra
Algebra
ISBN:
9781305115545
Author:
James Stewart, Lothar Redlin, Saleem Watson
Publisher:
Cengage Learning
Algebra and Trigonometry (MindTap Course List)
Algebra
ISBN:
9781305071742
Author:
James Stewart, Lothar Redlin, Saleem Watson
Publisher:
Cengage Learning
Algebra & Trigonometry with Analytic Geometry
Algebra
ISBN:
9781133382119
Author:
Swokowski
Publisher:
Cengage