I'm struggling to create 5 histograms for a set of data in Python. Conceptually the code should produce a histogram which gets smoother and closer to a normal curve as the number of values increases in the array. Mine are all plotting on the same graph however and are separated at weird values and I don't know why. They're not curve like at all. For reference, my 5 arrays of values are generated randomly from a normal distribution with a mean of 12, standard deviation of 1, and contain 5, 50, 500, 5000, and 5000000 values respectively.
I'm struggling to create 5 histograms for a set of data in Python. Conceptually the code should produce a histogram which gets smoother and closer to a normal curve as the number of values increases in the array. Mine are all plotting on the same graph however and are separated at weird values and I don't know why. They're not curve like at all. For reference, my 5 arrays of values are generated randomly from a normal distribution with a mean of 12, standard deviation of 1, and contain 5, 50, 500, 5000, and 5000000 values respectively.

Computer Networking: A Top-Down Approach (7th Edition)
7th Edition
ISBN:9780133594140
Author:James Kurose, Keith Ross
Publisher:James Kurose, Keith Ross
Chapter1: Computer Networks And The Internet
Section: Chapter Questions
Problem R1RQ: What is the difference between a host and an end system? List several different types of end...

Related questions
Question
100%
I'm struggling to create 5 histograms for a set of data in Python. Conceptually the code should produce a histogram which gets smoother and closer to a normal curve as the number of values increases in the array. Mine are all plotting on the same graph however and are separated at weird values and I don't know why. They're not curve like at all.
For reference, my 5 arrays of values are generated randomly from a normal distribution with a mean of 12, standard deviation of 1, and contain 5, 50, 500, 5000, and 5000000 values respectively.
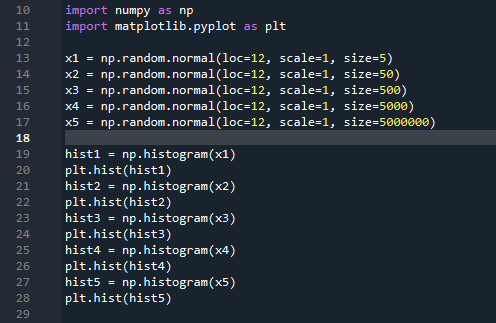
Transcribed Image Text:import numpy as np
import matplotlib.pyplot as plt
10
11
12
np.random.normal(loc=12, scale=1, size=5)
np.random.normal(loc=12, scale=1, size=50)
np.random.normal(loc=12, scale=1, size=500)
np.random.normal(loc=12, scale=1, size=5000)
np.random.normal(loc=12, scale=1, size=5000000)
13
x1 =
14
x2 =
15
x3 =
16
x4 =
17
x5 =
18
histl - np.histogram(x1)
plt.hist(hist1)
19
20
21
hist2 =
np.histogram(x2)
22
plt.hist(hist2)
23
hist3 =
np.histogram(x3)
24
plt.hist(hist3)
25
hist4 =
np.histogram(x4)
26
plt.hist(hist4)
27
hist5 =
np.histogram(x5)
28
plt.hist(hist5)
29

Transcribed Image Text:10
8
6
4
0.00
0.25
0.50
0.75
1.00
125
150
175
lеб
2.
Expert Solution
This question has been solved!
Explore an expertly crafted, step-by-step solution for a thorough understanding of key concepts.

This is a popular solution!

Trending now
This is a popular solution!

Step by step
Solved in 3 steps with 1 images

Recommended textbooks for you
Computer Networking: A Top-Down Approach (7th Edi…
Computer Engineering
ISBN:
9780133594140
Author:
James Kurose, Keith Ross
Publisher:
PEARSON

Computer Organization and Design MIPS Edition, Fi…
Computer Engineering
ISBN:
9780124077263
Author:
David A. Patterson, John L. Hennessy
Publisher:
Elsevier Science

Network+ Guide to Networks (MindTap Course List)
Computer Engineering
ISBN:
9781337569330
Author:
Jill West, Tamara Dean, Jean Andrews
Publisher:
Cengage Learning
Computer Networking: A Top-Down Approach (7th Edi…
Computer Engineering
ISBN:
9780133594140
Author:
James Kurose, Keith Ross
Publisher:
PEARSON
Computer Organization and Design MIPS Edition, Fi…
Computer Engineering
ISBN:
9780124077263
Author:
David A. Patterson, John L. Hennessy
Publisher:
Elsevier Science
Network+ Guide to Networks (MindTap Course List)
Computer Engineering
ISBN:
9781337569330
Author:
Jill West, Tamara Dean, Jean Andrews
Publisher:
Cengage Learning

Concepts of Database Management
Computer Engineering
ISBN:
9781337093422
Author:
Joy L. Starks, Philip J. Pratt, Mary Z. Last
Publisher:
Cengage Learning

Prelude to Programming
Computer Engineering
ISBN:
9780133750423
Author:
VENIT, Stewart
Publisher:
Pearson Education

Sc Business Data Communications and Networking, T…
Computer Engineering
ISBN:
9781119368830
Author:
FITZGERALD
Publisher:
WILEY