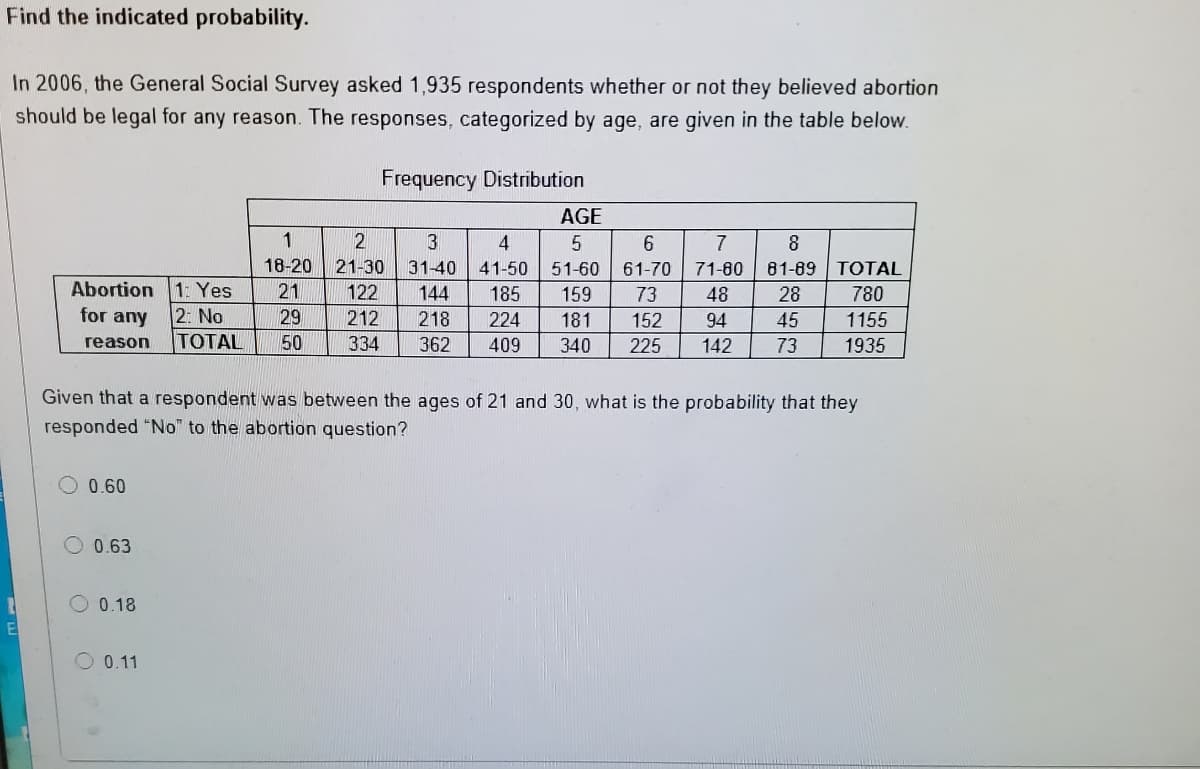
In 2006, the General Social Survey asked 1,935 respondents whether or not they believed abortion should be legal for any reason. The responses, categorized by age, are given in the table below. Frequency Distribution AGE 1 2 4 6. 7 8 18-20 21-30 31-40 61-70 73 41-50 51-60 71-80 81-69 TOTAL Abortion 1: Yes 2: No TOTAL 21 122 144 185 159 48 28 780 for any 218 362 29 212 224 181 152 94 45 1155 reason 50 334 409 340 225 142 73 1935 Given that a respondent was between the ages of 21 and 30, what is the probability that they responded "No" to the abortion question? O 0.60 O 0.63 0.18 O 0.11
In 2006, the General Social Survey asked 1,935 respondents whether or not they believed abortion should be legal for any reason. The responses, categorized by age, are given in the table below. Frequency Distribution AGE 1 2 4 6. 7 8 18-20 21-30 31-40 61-70 73 41-50 51-60 71-80 81-69 TOTAL Abortion 1: Yes 2: No TOTAL 21 122 144 185 159 48 28 780 for any 218 362 29 212 224 181 152 94 45 1155 reason 50 334 409 340 225 142 73 1935 Given that a respondent was between the ages of 21 and 30, what is the probability that they responded "No" to the abortion question? O 0.60 O 0.63 0.18 O 0.11

Chapter8: Sequences, Series,and Probability
Section8.7: Probability
Problem 4ECP: Show that the probability of drawing a club at random from a standard deck of 52 playing cards is...

Related questions
Question
Transcribed Image Text:Find the indicated probability.
In 2006, the General Social Survey asked 1,935 respondents whether or not they believed abortion
should be legal for any reason. The responses, categorized by age, are given in the table below.
Frequency Distribution
AGE
3
4
6.
7
8
18-20
21-30
31-40
41-50
51-60
61-70
71-80
81-69 TOTAL
Abortion 1: Yes
2: No
TOTAL
21
122
144
185
159
73
48
28
780
for any
29
212
218
224
181
152
94
45
1155
reason
50
334
362
409
340
225
142
73
1935
Given that a respondent was between the ages of 21 and 30, what is the probability that they
responded "No" to the abortion question?
0.60
0.63
O 0.18
O 0.11
Expert Solution
This question has been solved!
Explore an expertly crafted, step-by-step solution for a thorough understanding of key concepts.

This is a popular solution!

Trending now
This is a popular solution!

Step by step
Solved in 2 steps

Recommended textbooks for you