In a fabric manufacturing factory, the quality control process using control charts from SPC. In an hour there are a total of 5 samples are taken each having 4 observations regarding the thickness of fabric in measured in millimeters. In a particular hour, the sample means 189.31, 102.22, and112.09 respectively. In the same sample, the corresponding ranges are: 11.97, 12.17, 13.94, 11.86, and 11.83 respectively. What are the lower and upper control limits for the R chart? -bar) are noted to be: 156.46, 199.62, O a. 0, 29.17 O b. 0,31.17 O c. 0,30.47 O d. 0,24.71 O e. 0,28.17 Of. None is correct
In a fabric manufacturing factory, the quality control process using control charts from SPC. In an hour there are a total of 5 samples are taken each having 4 observations regarding the thickness of fabric in measured in millimeters. In a particular hour, the sample means 189.31, 102.22, and112.09 respectively. In the same sample, the corresponding ranges are: 11.97, 12.17, 13.94, 11.86, and 11.83 respectively. What are the lower and upper control limits for the R chart? -bar) are noted to be: 156.46, 199.62, O a. 0, 29.17 O b. 0,31.17 O c. 0,30.47 O d. 0,24.71 O e. 0,28.17 Of. None is correct

Practical Management Science
6th Edition
ISBN:9781337406659
Author:WINSTON, Wayne L.
Publisher:WINSTON, Wayne L.
Chapter2: Introduction To Spreadsheet Modeling
Section: Chapter Questions
Problem 20P: Julie James is opening a lemonade stand. She believes the fixed cost per week of running the stand...

Related questions
Question
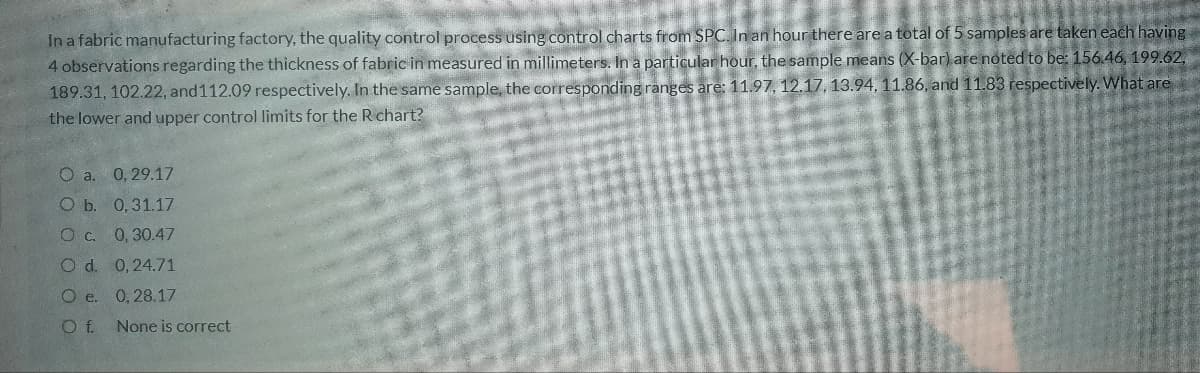
Transcribed Image Text:In a fabric manufacturing factory, the quality control process using control charts from SPC. In an hour there are a total of 5 samples are taken each having
4 observations regarding the thickness of fabric in measured in millimeters. In a particular hour, the sample means (X-bar) are noted to be: 156.46, 199.62,
189.31, 102.22, and112.09 respectively. In the same sample, the corresponding ranges are: 11.97, 12.17, 13.94, 11.86, and 11.83 respectively. What are
the lower and upper control limits for the Rchart?
O a. 0,29.17
O b. 0,31.17
O c. 0,30.47
O d. 0,24.71
O e. 0, 28.17
Of.
None is correct
Expert Solution
This question has been solved!
Explore an expertly crafted, step-by-step solution for a thorough understanding of key concepts.

Step by step
Solved in 2 steps with 3 images

Recommended textbooks for you
Practical Management Science
Operations Management
ISBN:
9781337406659
Author:
WINSTON, Wayne L.
Publisher:
Cengage,

Operations Management
Operations Management
ISBN:
9781259667473
Author:
William J Stevenson
Publisher:
McGraw-Hill Education

Operations and Supply Chain Management (Mcgraw-hi…
Operations Management
ISBN:
9781259666100
Author:
F. Robert Jacobs, Richard B Chase
Publisher:
McGraw-Hill Education
Practical Management Science
Operations Management
ISBN:
9781337406659
Author:
WINSTON, Wayne L.
Publisher:
Cengage,
Operations Management
Operations Management
ISBN:
9781259667473
Author:
William J Stevenson
Publisher:
McGraw-Hill Education
Operations and Supply Chain Management (Mcgraw-hi…
Operations Management
ISBN:
9781259666100
Author:
F. Robert Jacobs, Richard B Chase
Publisher:
McGraw-Hill Education


Purchasing and Supply Chain Management
Operations Management
ISBN:
9781285869681
Author:
Robert M. Monczka, Robert B. Handfield, Larry C. Giunipero, James L. Patterson
Publisher:
Cengage Learning

Production and Operations Analysis, Seventh Editi…
Operations Management
ISBN:
9781478623069
Author:
Steven Nahmias, Tava Lennon Olsen
Publisher:
Waveland Press, Inc.