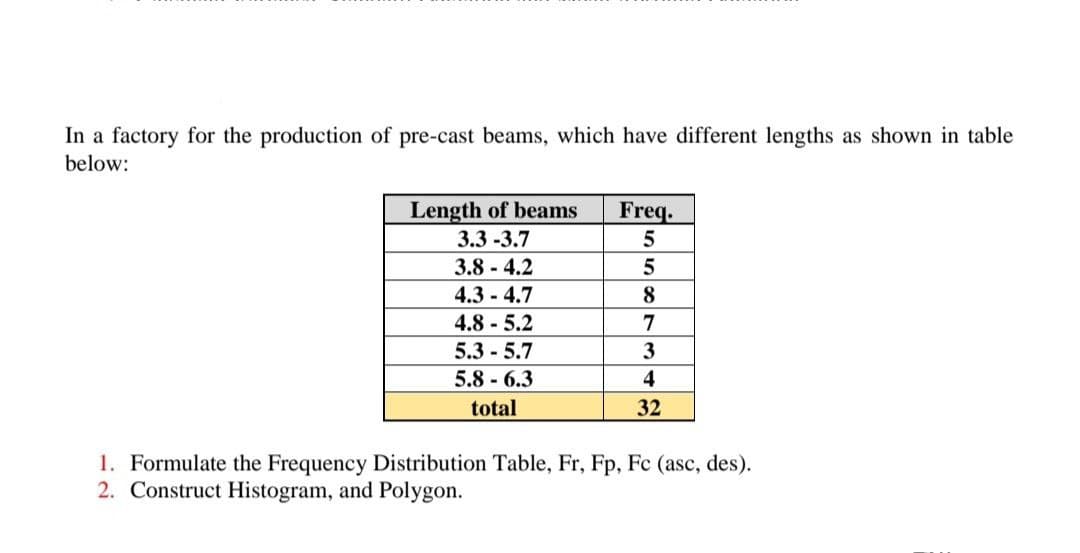
In a factory for the production of pre-cast beams, which have different lengths as shown in table below: Length of beams 3.3 -3.7 Freq. 3.8 - 4.2 4.3-4.7 8 4.8-5.2 7 5.3 5.7 5.8 - 6.3 4 total 32 1. Formulate the Frequency Distribution Table, Fr, Fp, Fc (asc, des). 2. Construct Histogram, and Polygon.
In a factory for the production of pre-cast beams, which have different lengths as shown in table below: Length of beams 3.3 -3.7 Freq. 3.8 - 4.2 4.3-4.7 8 4.8-5.2 7 5.3 5.7 5.8 - 6.3 4 total 32 1. Formulate the Frequency Distribution Table, Fr, Fp, Fc (asc, des). 2. Construct Histogram, and Polygon.

Glencoe Algebra 1, Student Edition, 9780079039897, 0079039898, 2018
18th Edition
ISBN:9780079039897
Author:Carter
Publisher:Carter
Chapter10: Statistics
Section10.6: Summarizing Categorical Data
Problem 21PPS

Related questions

Concept explainers
Contingency Table
A contingency table can be defined as the visual representation of the relationship between two or more categorical variables that can be evaluated and registered. It is a categorical version of the scatterplot, which is used to investigate the linear relationship between two variables. A contingency table is indeed a type of frequency distribution table that displays two variables at the same time.
Binomial Distribution
Binomial is an algebraic expression of the sum or the difference of two terms. Before knowing about binomial distribution, we must know about the binomial theorem.
Topic Video
Question
None
Transcribed Image Text:In a factory for the production of pre-cast beams, which have different lengths as shown in table
below:
Length of beams
3.3 -3.7
Freq.
3.8 4.2
4.3 - 4.7
8
4.8-5.2
7
5.3 - 5.7
5.8 6.3
total
32
1. Formulate
2. Construct Histogram, and Polygon.
Frequency Distribution Table, Fr, Fp, Fc (asc, des).
Expert Solution
This question has been solved!
Explore an expertly crafted, step-by-step solution for a thorough understanding of key concepts.

Step by step
Solved in 5 steps with 2 images

Knowledge Booster


Learn more about
Need a deep-dive on the concept behind this application? Look no further. Learn more about this topic, probability and related others by exploring similar questions and additional content below.Recommended textbooks for you
Glencoe Algebra 1, Student Edition, 9780079039897…
Algebra
ISBN:
9780079039897
Author:
Carter
Publisher:
McGraw Hill
Glencoe Algebra 1, Student Edition, 9780079039897…
Algebra
ISBN:
9780079039897
Author:
Carter
Publisher:
McGraw Hill