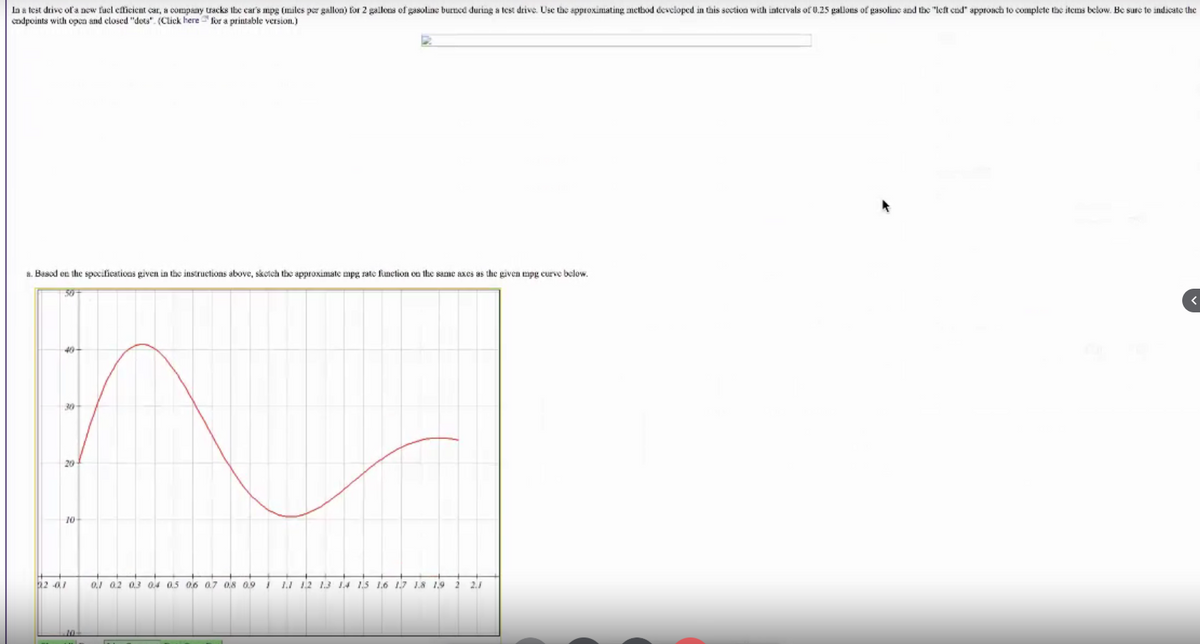
In a test drive of a new fuel efficient car, a company tracks the car's mpg (miles per gallon) for 2 gallons of gasoline burned during a test drive. Use the approximating method developed in this section with intervals of 0.25 gallons of gasoline and the "left end" approach to complete the items below. Be sure to indicate the endpoints with open and closed "dots".
In a test drive of a new fuel efficient car, a company tracks the car's mpg (miles per gallon) for 2 gallons of gasoline burned during a test drive. Use the approximating method developed in this section with intervals of 0.25 gallons of gasoline and the "left end" approach to complete the items below. Be sure to indicate the endpoints with open and closed "dots".

Elementary Geometry For College Students, 7e
7th Edition
ISBN:9781337614085
Author:Alexander, Daniel C.; Koeberlein, Geralyn M.
Publisher:Alexander, Daniel C.; Koeberlein, Geralyn M.
Chapter8: Areas Of Polygons And Circles
Section8.CR: Review Exercises
Problem 40CR: Sue and Daves semicircular driveway is to be resealed, and then flowers are to be planted on either...

Related questions

Question
In a test drive of a new fuel efficient car, a company tracks the car's mpg (miles per gallon) for 2 gallons of gasoline burned during a test drive. Use the approximating method developed in this section with intervals of 0.25 gallons of gasoline and the "left end" approach to complete the items below. Be sure to indicate the endpoints with open and closed "dots".
A) based on the specifications given in the instructions above, sketch the approximate mpg rate function on the same axes as the given mpg curve below.
Transcribed Image Text:la a test drive oľa new fuel efficient car, a company tracks the car's mpg (miles per gallon) for 2 gallens of gasoline burned during a test drive. Use the approximating metbod developed in this section with intervals of 0.25 pallons of gasoline and the "left cud" approach to complete the items beclow. Be sure te indicate the
cndpoints with open and elosed "dos". (Click here for a printable version.)
a. Basod en the spocilications given in the instructions above, sketch the approximate mpg rate finction en the same axes as the given mpg curve below.
50
40+
30+
20
10
0.1 02 03 04 0.5 0,6 0.7 08 09I
1.1 12 1.3 14 15 1,6 .7 18 19
2.
10
![b. Represent numerically approximations for the variations in the number of miles driven and the cumalative number of miles driven for every 0.25 gallans af gasoline burned given the exat rate of change function: 30e
* sin(da) + 20
Number of gallons of gasoline burned
O to 0.25
Approximate variations in the mumber of miles driven
39. 6601
Approximate cumulative number of miles driven
Preview
39 6601
Preview
0.25 to 0.5
36. 5455
Preview
76 2056
]Preview
0.5 to 0,75
21.9998
Preview
98 2054
Preview
0.75 to 1.0
116476
Preview
109 853
Preview
1.0 to 1.25
11.7579
Preview
1216109
Preview
1.25 to 1.5
18. 1296
Preview
139 7405
Preview
1.5 to 1,75
23.4250
Preview
163. 1655
] Preview
1.75 to 2.0
24.0168
Preview
187 1823
Preview
c. Represent the cumulative numher of miles driven graphically below. The first segment is drawn for you. (Use part b)
50
45
40
35
30-
25
20
15-
10-
5-
0.1 02 03 04 05 06 07 08 09
1I 12 1.3 4 13 1.6 17 18 19 2
2.1
5-
Clear All Draw: Line Segment
d. Approximate the total variation în miles driven for the finst 0.9 galkans hurned: 112.8079
Preview
miles](/v2/_next/image?url=https%3A%2F%2Fcontent.bartleby.com%2Fqna-images%2Fquestion%2Fa18616d8-56e9-43a1-a717-0fc009b11f8b%2Feec40502-2df2-4e84-ab27-79dba758780e%2F81q6jf_processed.png&w=3840&q=75)
Transcribed Image Text:b. Represent numerically approximations for the variations in the number of miles driven and the cumalative number of miles driven for every 0.25 gallans af gasoline burned given the exat rate of change function: 30e
* sin(da) + 20
Number of gallons of gasoline burned
O to 0.25
Approximate variations in the mumber of miles driven
39. 6601
Approximate cumulative number of miles driven
Preview
39 6601
Preview
0.25 to 0.5
36. 5455
Preview
76 2056
]Preview
0.5 to 0,75
21.9998
Preview
98 2054
Preview
0.75 to 1.0
116476
Preview
109 853
Preview
1.0 to 1.25
11.7579
Preview
1216109
Preview
1.25 to 1.5
18. 1296
Preview
139 7405
Preview
1.5 to 1,75
23.4250
Preview
163. 1655
] Preview
1.75 to 2.0
24.0168
Preview
187 1823
Preview
c. Represent the cumulative numher of miles driven graphically below. The first segment is drawn for you. (Use part b)
50
45
40
35
30-
25
20
15-
10-
5-
0.1 02 03 04 05 06 07 08 09
1I 12 1.3 4 13 1.6 17 18 19 2
2.1
5-
Clear All Draw: Line Segment
d. Approximate the total variation în miles driven for the finst 0.9 galkans hurned: 112.8079
Preview
miles
Expert Solution
This question has been solved!
Explore an expertly crafted, step-by-step solution for a thorough understanding of key concepts.

This is a popular solution!

Trending now
This is a popular solution!

Step by step
Solved in 2 steps with 2 images

Knowledge Booster


Learn more about
Need a deep-dive on the concept behind this application? Look no further. Learn more about this topic, advanced-math and related others by exploring similar questions and additional content below.Recommended textbooks for you
Elementary Geometry For College Students, 7e
Geometry
ISBN:
9781337614085
Author:
Alexander, Daniel C.; Koeberlein, Geralyn M.
Publisher:
Cengage,

Elementary Geometry for College Students
Geometry
ISBN:
9781285195698
Author:
Daniel C. Alexander, Geralyn M. Koeberlein
Publisher:
Cengage Learning
Elementary Geometry For College Students, 7e
Geometry
ISBN:
9781337614085
Author:
Alexander, Daniel C.; Koeberlein, Geralyn M.
Publisher:
Cengage,
Elementary Geometry for College Students
Geometry
ISBN:
9781285195698
Author:
Daniel C. Alexander, Geralyn M. Koeberlein
Publisher:
Cengage Learning