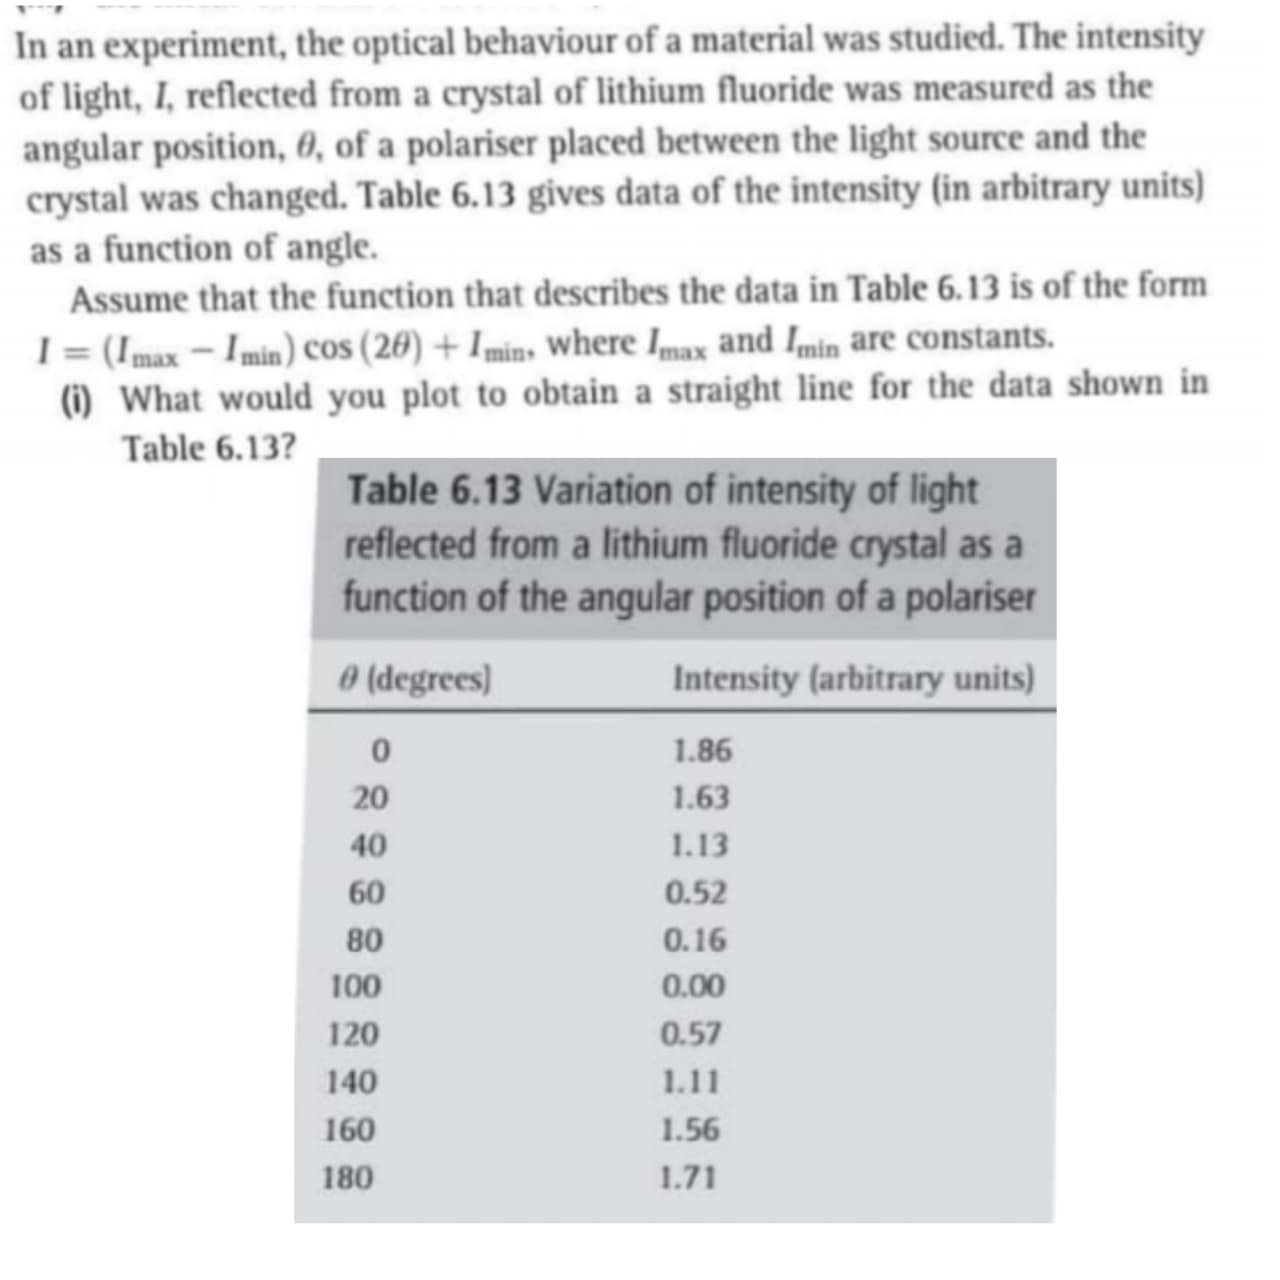
In an experiment, the optical behaviour of a material was studied. The intensity of light, I, reflected from a crystal of lithium fluoride was measured as the angular position, 0, of a polariser placed between the light source and the crystal was changed. Table 6.13 gives data of the intensity (in arbitrary units) as a function of angle. Assume that the function that describes the data in Table 6.13 is of the form I= (Imax – I min) cos (20) + Imin, where Imax and Imin are constants. (i) What would you plot to obtain a straight line for the data shown in Table 6.13? Table 6.13 Variation of intensity of light reflected from a lithium fluoride crystal as a function of the angular position of a polariser 0 (degrees) Intensity (arbitrary units) 1.86 20 1.63 40 1.13 60 0.52 80 0.16 100 0.00 120 0.57 140 1.11 160 1.56 180 1.71
In an experiment, the optical behaviour of a material was studied. The intensity of light, I, reflected from a crystal of lithium fluoride was measured as the angular position, 0, of a polariser placed between the light source and the crystal was changed. Table 6.13 gives data of the intensity (in arbitrary units) as a function of angle. Assume that the function that describes the data in Table 6.13 is of the form I= (Imax – I min) cos (20) + Imin, where Imax and Imin are constants. (i) What would you plot to obtain a straight line for the data shown in Table 6.13? Table 6.13 Variation of intensity of light reflected from a lithium fluoride crystal as a function of the angular position of a polariser 0 (degrees) Intensity (arbitrary units) 1.86 20 1.63 40 1.13 60 0.52 80 0.16 100 0.00 120 0.57 140 1.11 160 1.56 180 1.71

Related questions
Question
Transcribed Image Text:In an experiment, the optical behaviour of a material was studied. The intensity
of light, I, reflected from a crystal of lithium fluoride was measured as the
angular position, 0, of a polariser placed between the light source and the
crystal was changed. Table 6.13 gives data of the intensity (in arbitrary units)
as a function of angle.
Assume that the function that describes the data in Table 6.13 is of the form
I= (Imax – I min) cos (20) + Imin, where Imax and Imin are constants.
(i) What would you plot to obtain a straight line for the data shown in
Table 6.13?
Table 6.13 Variation of intensity of light
reflected from a lithium fluoride crystal as a
function of the angular position of a polariser
0 (degrees)
Intensity (arbitrary units)
1.86
20
1.63
40
1.13
60
0.52
80
0.16
100
0.00
120
0.57
140
1.11
160
1.56
180
1.71
Expert Solution
This question has been solved!
Explore an expertly crafted, step-by-step solution for a thorough understanding of key concepts.

Step by step
Solved in 2 steps with 2 images
