In millions, except per share data Years ended December 31, 2019 2018 2017 REVENUES Sales by Company-operated restaurants Revenues from franchised restaurants $ 9,420.8 $ 10,012.7 $ 12,718.9 11,655.7 11,012.5 10,101.5 Total revenưes ...... .. 21,076.5 21,025.2 22,820.4 ..... ............. ... .................. OPERATING COSTS'AND EXPENSES Company-operated restaurant expenses Food & paper 2,980.3 3,153.8 4,033.5 Payroll & employee benefits Occupancy & other operating expenses ranchised restaurants-occupancy expenses 2,704.4 2,937.9 3,528.5 2,075.9 2,174.2 2,847.6 2,200.6 1,973.3 1,790.0 elling, general & administrative expenses ther operating (income) expense, net Total operating costs and expenses perating income erest expense-net of capitalized interest of $7.4, $5.6 and $5.3 2,229.4 2,200.2 2,231.3 (183.9) (236.8) (1,163.2) 12,006.7 12,202.6 13,267.7 8,822.6 981.2 9,069.8 9,552.7 1,121.9 921.3 ד
In millions, except per share data Years ended December 31, 2019 2018 2017 REVENUES Sales by Company-operated restaurants Revenues from franchised restaurants $ 9,420.8 $ 10,012.7 $ 12,718.9 11,655.7 11,012.5 10,101.5 Total revenưes ...... .. 21,076.5 21,025.2 22,820.4 ..... ............. ... .................. OPERATING COSTS'AND EXPENSES Company-operated restaurant expenses Food & paper 2,980.3 3,153.8 4,033.5 Payroll & employee benefits Occupancy & other operating expenses ranchised restaurants-occupancy expenses 2,704.4 2,937.9 3,528.5 2,075.9 2,174.2 2,847.6 2,200.6 1,973.3 1,790.0 elling, general & administrative expenses ther operating (income) expense, net Total operating costs and expenses perating income erest expense-net of capitalized interest of $7.4, $5.6 and $5.3 2,229.4 2,200.2 2,231.3 (183.9) (236.8) (1,163.2) 12,006.7 12,202.6 13,267.7 8,822.6 981.2 9,069.8 9,552.7 1,121.9 921.3 ד

Corporate Financial Accounting
14th Edition
ISBN:9781305653535
Author:Carl Warren, James M. Reeve, Jonathan Duchac
Publisher:Carl Warren, James M. Reeve, Jonathan Duchac
Chapter3: The Adjusting Process
Section: Chapter Questions
Problem 3.1ADM

Related questions
Question
100%
Transcribed Image Text:Styles
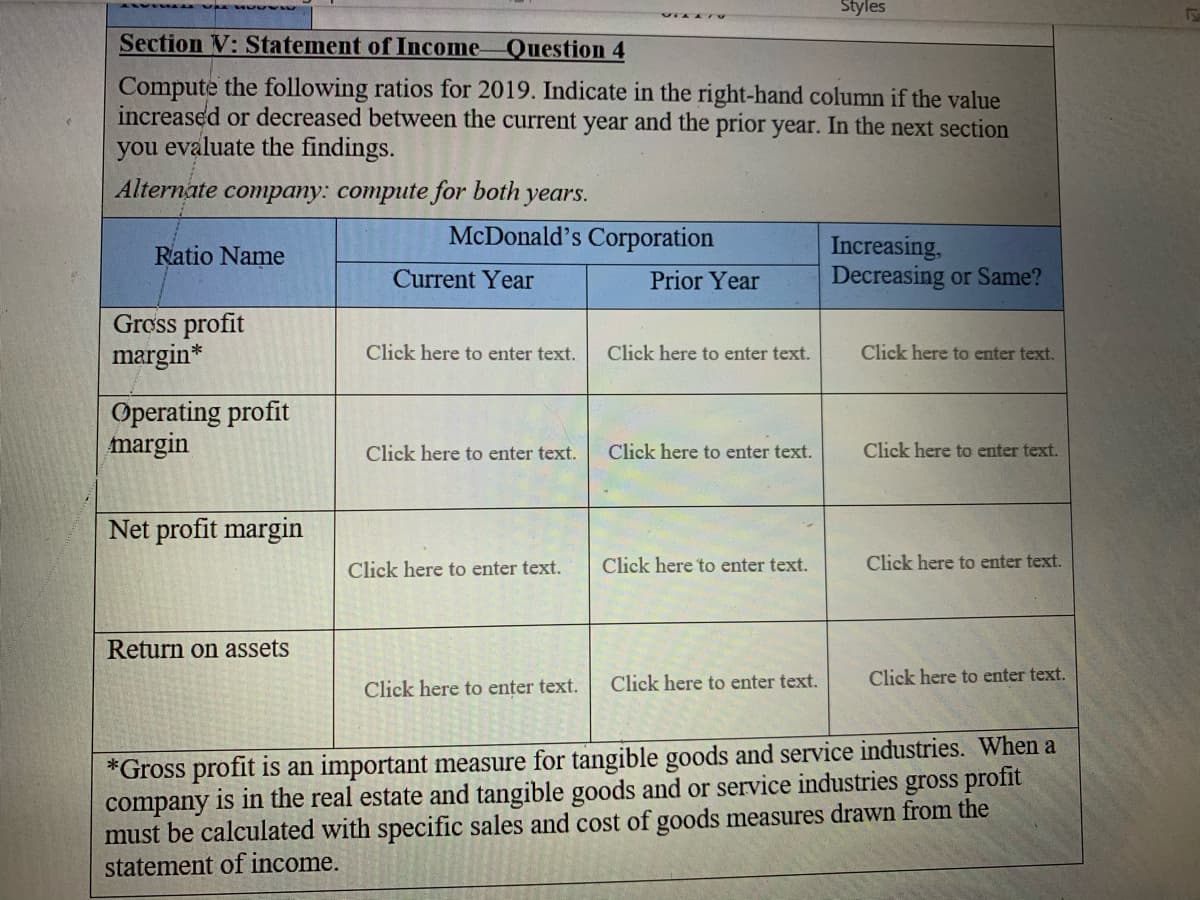
Section V: Statement of Income
Question 4
Compute the following ratios for 2019. Indicate in the right-hand column if the value
increased or decreased between the current year and the prior year. In the next section
you evaluate the findings.
Alternate company: compute for both years.
McDonald's Corporation
Increasing,
Decreasing or Same?
Ratio Name
Current Year
Prior Year
Gross profit
margin*
Click here to enter text.
Click here to enter text.
Click here to enter text.
Operating profit
margin
Click here to enter text.
Click here to enter text.
Click here to enter text.
Net profit margin
Click here to enter text.
Click here to enter text.
Click here to enter text.
Return on assets
Click here to enter text.
Click here to enter text.
Click here to enter text.
*Gross profit is an important measure for tangible goods and service industries. When a
company is in the real estate and tangible goods and or service industries gross profit
must be calculated with specific sales and cost of goods measures drawn from the
statement of income.
Transcribed Image Text:A Read aloud
7 Draw
H Highlight
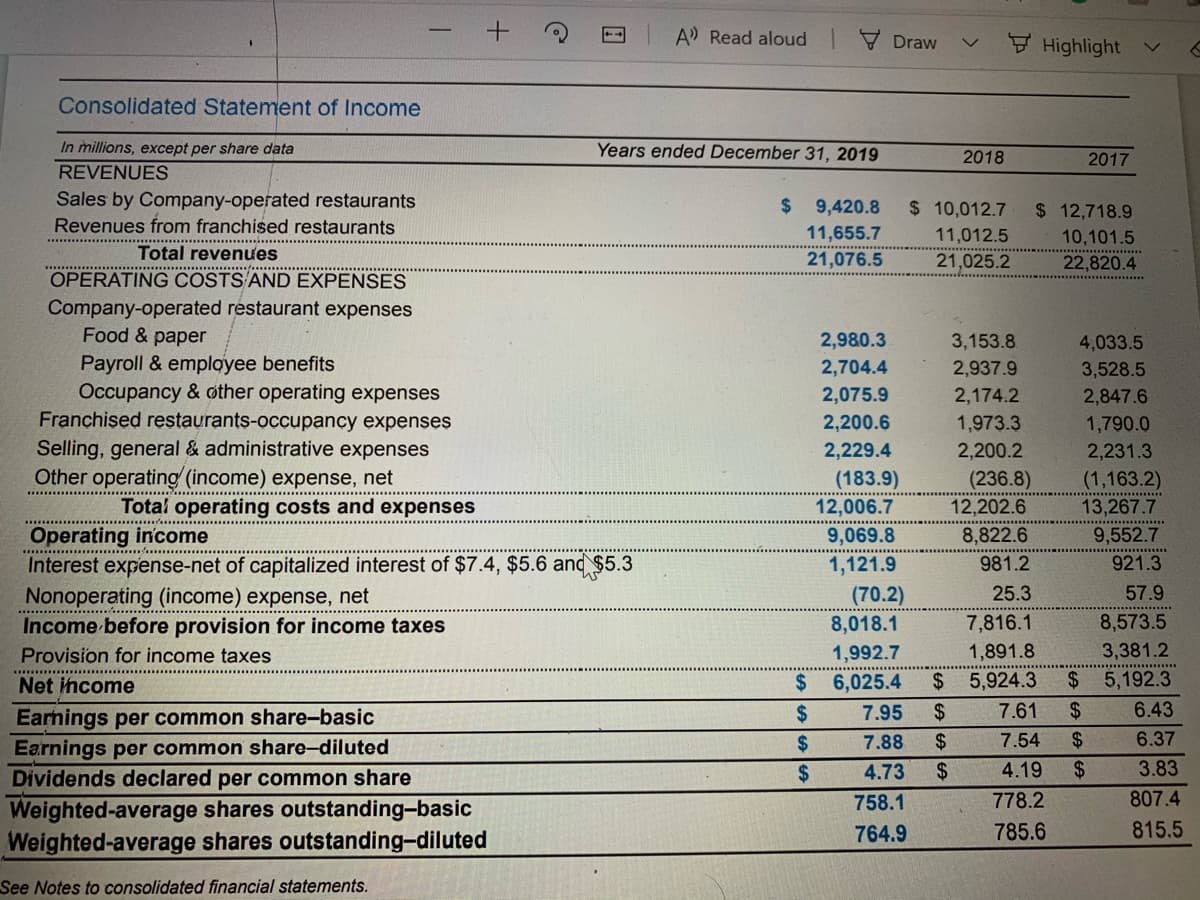
Consolidated Statement of Income
In millions, except per share data
Years ended December 31, 2019
2018
2017
REVENUES
Sales by Company-operated restaurants
Revenues from franchised restaurants
%24
9,420.8
$ 10,012.7
$ 12,718.9
11,655.7
11,012.5
10,101.5
Total revenues
21,076.5
21,025.2
22,820.4
............................
OPERATING COSTS'AND EXPENSES
Company-operated restaurant expenses
Food & paper
2,980.3
3,153.8
4,033.5
Payroll & emplgyee benefits
Occupancy & other operating expenses
Franchised restaurants-occupancy expenses
Selling, general & administrative expenses
Other operating (income) expense, net
2,704.4
2,075.9
2,937.9
3,528.5
2,174.2
2,847.6
2,200.6
1,973.3
1,790.0
2,229.4
2,200.2
2,231.3
(183.9)
(236.8)
(1,163.2)
13,267.7
Total operating costs and expenses
12,006.7
12,202.6
Operating income
Interest expense-net of capitalized interest of $7.4, $5.6 and $5.3
Nonoperating (income) expense, net
Income before provision for income taxes
9,069.8
8,822.6
9,552.7
1,121.9
981.2
921.3
25.3
57.9
(70.2)
8,018.1
7,816.1
8,573.5
1,891.8
3,381.2
1,992.7
%$4
Provision for income taxes
.................
Net income
2$
6,025.4
5,924.3
24
5,192.3
24
7.95
2$
7.61
2$
6.43
Earnings per common share-basic
Earnings per common share-diluted
Dividends declared per common share
2$
7.88
2$
7.54
2$
6.37
24
4.73
2$
4.19
2$
3.83
758.1
778.2
807.4
Weighted-average shares outstanding-basic
Weighted-average shares outstanding-diluted
764.9
785.6
815.5
See Notes to consolidated financial statements.
Expert Solution
This question has been solved!
Explore an expertly crafted, step-by-step solution for a thorough understanding of key concepts.

This is a popular solution!

Trending now
This is a popular solution!

Step by step
Solved in 2 steps

Knowledge Booster


Learn more about
Need a deep-dive on the concept behind this application? Look no further. Learn more about this topic, accounting and related others by exploring similar questions and additional content below.Recommended textbooks for you
Corporate Financial Accounting
Accounting
ISBN:
9781305653535
Author:
Carl Warren, James M. Reeve, Jonathan Duchac
Publisher:
Cengage Learning

Financial & Managerial Accounting
Accounting
ISBN:
9781337119207
Author:
Carl Warren, James M. Reeve, Jonathan Duchac
Publisher:
Cengage Learning

Cornerstones of Financial Accounting
Accounting
ISBN:
9781337690881
Author:
Jay Rich, Jeff Jones
Publisher:
Cengage Learning
Corporate Financial Accounting
Accounting
ISBN:
9781305653535
Author:
Carl Warren, James M. Reeve, Jonathan Duchac
Publisher:
Cengage Learning
Financial & Managerial Accounting
Accounting
ISBN:
9781337119207
Author:
Carl Warren, James M. Reeve, Jonathan Duchac
Publisher:
Cengage Learning
Cornerstones of Financial Accounting
Accounting
ISBN:
9781337690881
Author:
Jay Rich, Jeff Jones
Publisher:
Cengage Learning

Intermediate Accounting: Reporting And Analysis
Accounting
ISBN:
9781337788281
Author:
James M. Wahlen, Jefferson P. Jones, Donald Pagach
Publisher:
Cengage Learning

Survey of Accounting (Accounting I)
Accounting
ISBN:
9781305961883
Author:
Carl Warren
Publisher:
Cengage Learning

Financial & Managerial Accounting
Accounting
ISBN:
9781285866307
Author:
Carl Warren, James M. Reeve, Jonathan Duchac
Publisher:
Cengage Learning