In order to study the effects of World War II on a certain country's economy, an economist used data from that country's census bureau to produce the following Lorenz curves for the distribution of income in 1935 and 1947. f(x) = x²2 Lorenz curve for 1935 1.6 g(x) = x Lorenz curve for 1947 Find the Gini index of income concentration for each Lorenz curve and interpret the results. What is the Gini index for 1935? (Round to three decimal places as needed.) What is the Gini index for 1947? (Round to three decimal places as needed.) Interpret your results. A. Income was more equally distributed in 1947. B. Income was more equally distributed in 1935. C. Income was distributed the same in 1935 as in 1947.
In order to study the effects of World War II on a certain country's economy, an economist used data from that country's census bureau to produce the following Lorenz curves for the distribution of income in 1935 and 1947. f(x) = x²2 Lorenz curve for 1935 1.6 g(x) = x Lorenz curve for 1947 Find the Gini index of income concentration for each Lorenz curve and interpret the results. What is the Gini index for 1935? (Round to three decimal places as needed.) What is the Gini index for 1947? (Round to three decimal places as needed.) Interpret your results. A. Income was more equally distributed in 1947. B. Income was more equally distributed in 1935. C. Income was distributed the same in 1935 as in 1947.

Chapter6: Exponential And Logarithmic Functions
Section6.8: Fitting Exponential Models To Data
Problem 3TI: Table 6 shows the population, in thousands, of harbor seals in the Wadden Sea over the years 1997 to...

Related questions
Question
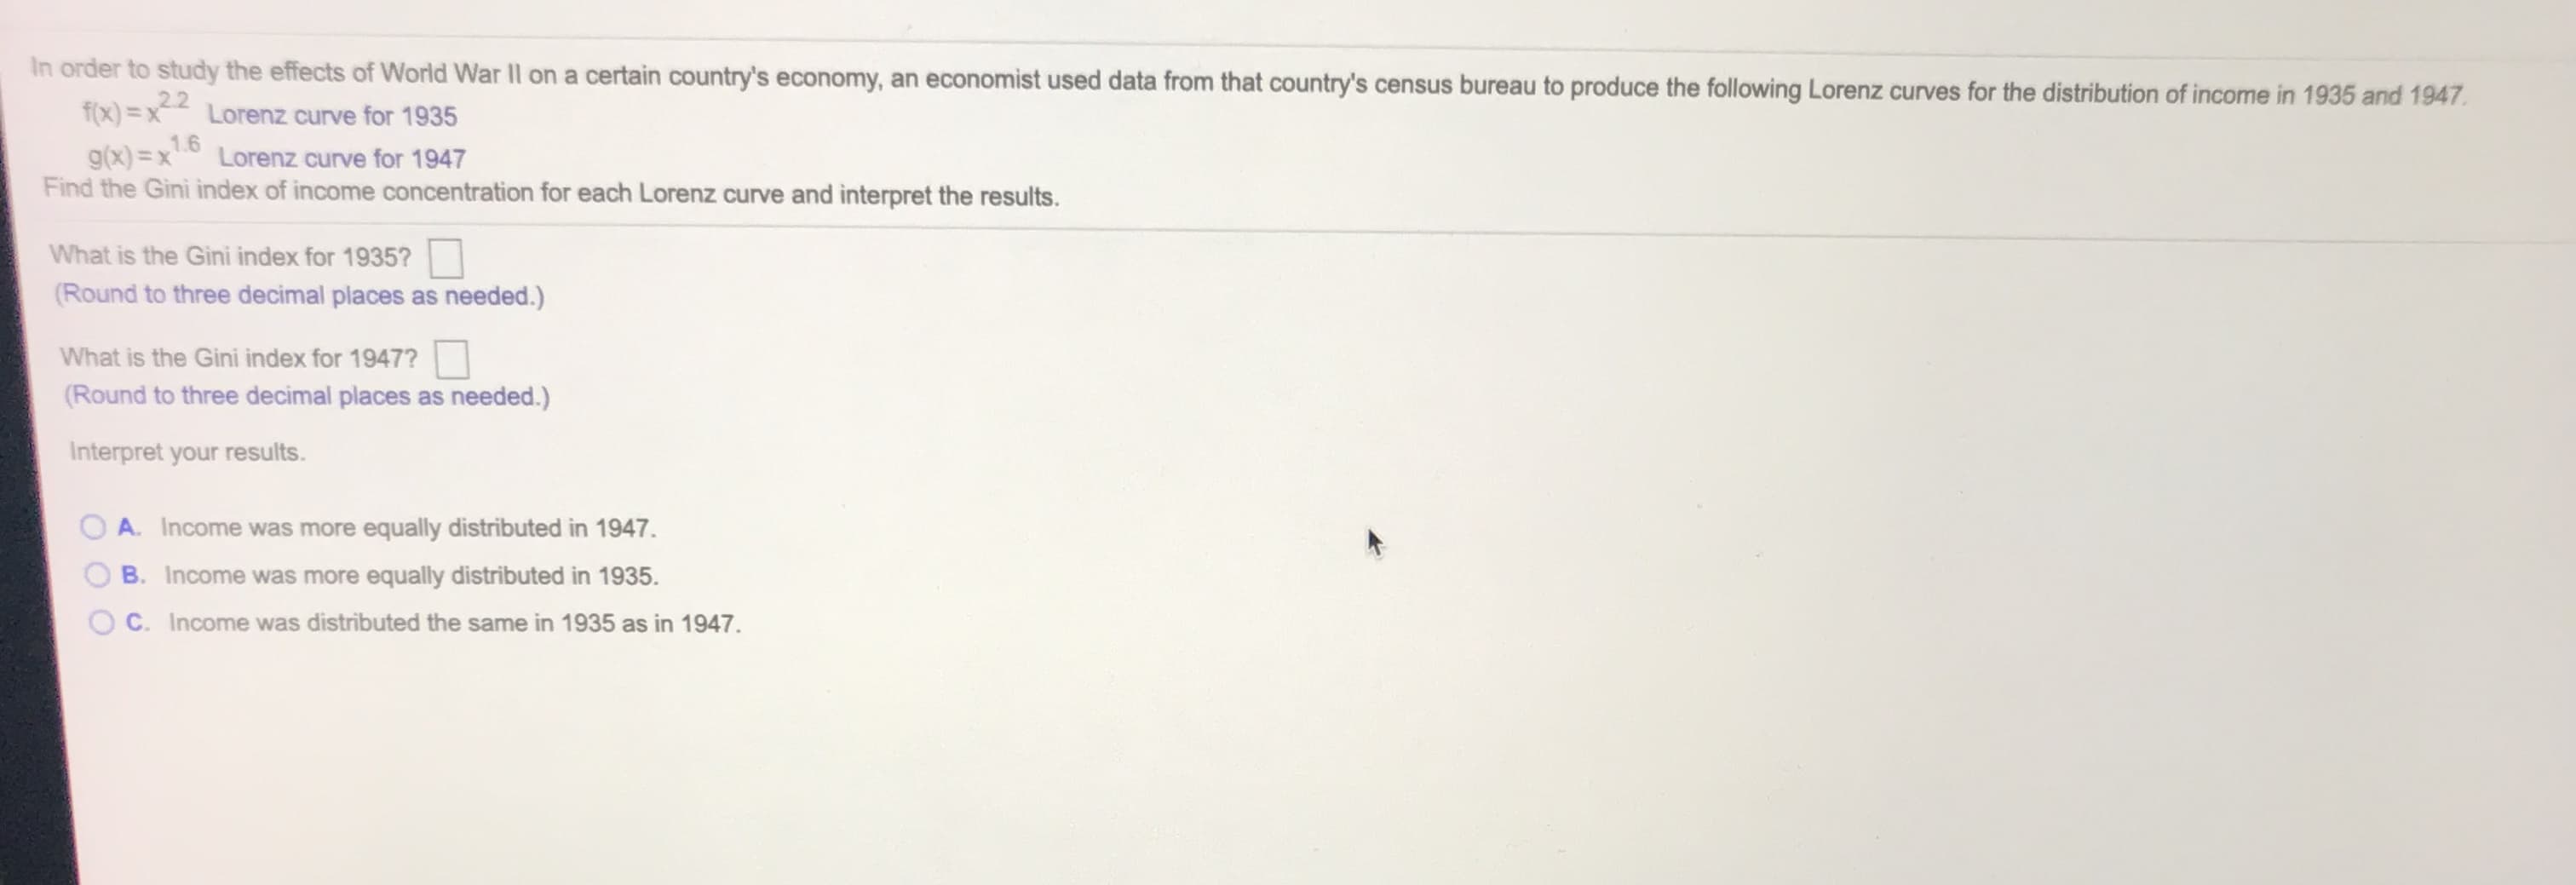
Transcribed Image Text:In order to study the effects of World War II on a certain country's economy, an economist used data from that country's census bureau to produce the following Lorenz curves for the distribution of income in 1935 and 1947.
f(x) = x²2 Lorenz curve for 1935
1.6
g(x) = x Lorenz curve for 1947
Find the Gini index of income concentration for each Lorenz curve and interpret the results.
What is the Gini index for 1935?
(Round to three decimal places as needed.)
What is the Gini index for 1947?
(Round to three decimal places as needed.)
Interpret your results.
A. Income was more equally distributed in 1947.
B. Income was more equally distributed in 1935.
C. Income was distributed the same in 1935 as in 1947.
Expert Solution
This question has been solved!
Explore an expertly crafted, step-by-step solution for a thorough understanding of key concepts.

This is a popular solution!

Trending now
This is a popular solution!

Step by step
Solved in 6 steps with 5 images

Recommended textbooks for you

Algebra & Trigonometry with Analytic Geometry
Algebra
ISBN:
9781133382119
Author:
Swokowski
Publisher:
Cengage
Algebra & Trigonometry with Analytic Geometry
Algebra
ISBN:
9781133382119
Author:
Swokowski
Publisher:
Cengage