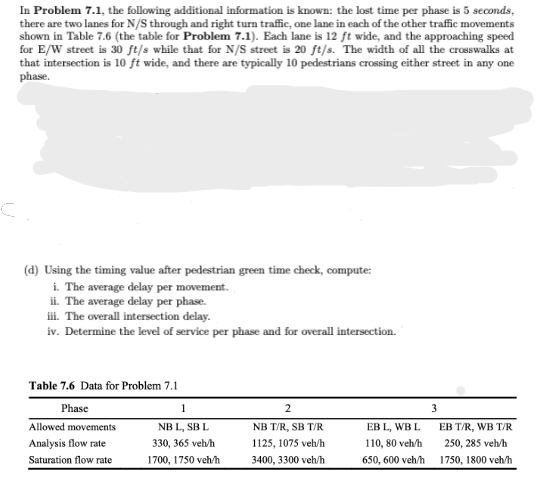
In Problem 7.1, the following additional information is known: the lost time per phase is 5 seconds, there are two lanes for N/S through and right turn traffic, one lane in each of the other traffic movements shown in Table 7.6 (the table for Problem 7.1). Each lane is 12 ft wide, and the approaching speed for E/W street is 30 ft/s while that for N/S street is 20 ft/s. The width of all the crosswalks at that intersection is 10 ft wide, and there are typically 10 pedestrians crossing either street in any one phase. (d) Using the timing value after pedestrian green time check, compute: i. The average delay per movement. ii. The average delay per phase. iii. The overall intersection delay. iv. Determine the level of service per phase and for overall intersection. Table 7.6 Data for Problem 7.1 Phase Allowed movements Analysis flow rate Saturation flow rate 1 NB L, SB L 330, 365 veh/h 1700, 1750 veh/h 2 NB T/R, SB T/R 1125, 1075 veh/h 3400, 3300 veh/h EB L, WB L 110, 80 veh/h 650, 600 veh/h 3 EB T/R, WB T/R 250, 285 veh/h 1750, 1800 veh/h
In Problem 7.1, the following additional information is known: the lost time per phase is 5 seconds, there are two lanes for N/S through and right turn traffic, one lane in each of the other traffic movements shown in Table 7.6 (the table for Problem 7.1). Each lane is 12 ft wide, and the approaching speed for E/W street is 30 ft/s while that for N/S street is 20 ft/s. The width of all the crosswalks at that intersection is 10 ft wide, and there are typically 10 pedestrians crossing either street in any one phase. (d) Using the timing value after pedestrian green time check, compute: i. The average delay per movement. ii. The average delay per phase. iii. The overall intersection delay. iv. Determine the level of service per phase and for overall intersection. Table 7.6 Data for Problem 7.1 Phase Allowed movements Analysis flow rate Saturation flow rate 1 NB L, SB L 330, 365 veh/h 1700, 1750 veh/h 2 NB T/R, SB T/R 1125, 1075 veh/h 3400, 3300 veh/h EB L, WB L 110, 80 veh/h 650, 600 veh/h 3 EB T/R, WB T/R 250, 285 veh/h 1750, 1800 veh/h

Chapter2: Loads On Structures
Section: Chapter Questions
Problem 1P

Related questions

Question
Transcribed Image Text:In Problem 7.1, the following additional information is known: the lost time per phase is 5 seconds,
there are two lanes for N/S through and right turn traffic, one lane in each of the other traffic movements
shown in Table 7.6 (the table for Problem 7.1). Each lane is 12 ft wide, and the approaching speed
for E/W street is 30 ft/s while that for N/S street is 20 ft/s. The width of all the crosswalks at
that intersection is 10 ft wide, and there are typically 10 pedestrians crossing either street in any one
phase.
(d) Using the timing value after pedestrian green time check, compute:
i. The average delay per movement.
ii. The average delay per phase.
iii. The overall intersection delay.
iv. Determine the level of service per phase and for overall intersection.
Table 7.6 Data for Problem 7.1
Phase
Allowed movements
Analysis flow rate
Saturation flow rate
1
NB L, SB L
330, 365 veh/h
1700, 1750 veh/h
2
NB T/R, SB T/R
1125, 1075 veh/h
3400, 3300 veh/h
EB L, WB L
110, 80 veh/h
650, 600 veh/h
3
EB T/R, WB T/R
250, 285 veh/h
1750, 1800 veh/h
Expert Solution
This question has been solved!
Explore an expertly crafted, step-by-step solution for a thorough understanding of key concepts.

This is a popular solution!
Step 1: Phase plan
VIEWStep 2: Convert turn flows to passenger car units
VIEWStep 3: Set up saturation flows and then calculate turn flow ratios.
VIEWStep 4: YELLOW AND ALL RED TIMES
VIEWStep 5: LOST TIMES
VIEWStep 6: CYCLE LENGTH calculations
VIEWStep 7: EFFECTIVE GREEN TIMES
VIEWStep 8: overall intersection delay
VIEWSolution
VIEW
Trending now
This is a popular solution!

Step by step
Solved in 9 steps with 12 images

Knowledge Booster


Learn more about
Need a deep-dive on the concept behind this application? Look no further. Learn more about this topic, civil-engineering and related others by exploring similar questions and additional content below.Recommended textbooks for you

Structural Analysis (10th Edition)
Civil Engineering
ISBN:
9780134610672
Author:
Russell C. Hibbeler
Publisher:
PEARSON

Principles of Foundation Engineering (MindTap Cou…
Civil Engineering
ISBN:
9781337705028
Author:
Braja M. Das, Nagaratnam Sivakugan
Publisher:
Cengage Learning
Structural Analysis (10th Edition)
Civil Engineering
ISBN:
9780134610672
Author:
Russell C. Hibbeler
Publisher:
PEARSON
Principles of Foundation Engineering (MindTap Cou…
Civil Engineering
ISBN:
9781337705028
Author:
Braja M. Das, Nagaratnam Sivakugan
Publisher:
Cengage Learning

Fundamentals of Structural Analysis
Civil Engineering
ISBN:
9780073398006
Author:
Kenneth M. Leet Emeritus, Chia-Ming Uang, Joel Lanning
Publisher:
McGraw-Hill Education


Traffic and Highway Engineering
Civil Engineering
ISBN:
9781305156241
Author:
Garber, Nicholas J.
Publisher:
Cengage Learning