In this experiment, students have utilized a long field coil (750mm, 484 turns/m), a short induction coil (300 turns, 32 mm diameter), a function generator, a voltmeter and an ampere meter. In this setup, field coil is connected in series with an ampere meter which is connected to a function generator to act as an adjustable frequency AC (alternating current) voltage supply. Induction coil is placed inside the field coil and connected to a voltmeter as shown in the picture below. At a fixed frequency of 20 kHz they have changed the applied voltage and recorded readings of the ampere meter and volt meter. With these results they have constructed the graph below and fitted their results to a linear regression and obtained the equation shown in the graph; 320 y = 21.57x + 61.13 R? = 0.98 240 160 80 2 4 8. 10 l6 (mA) Calculate the magnetic constant from these experimental data by utilizing the slope of the given graph and compare your result with theoretical data by calculating error percentage. (nw) Bun
In this experiment, students have utilized a long field coil (750mm, 484 turns/m), a short induction coil (300 turns, 32 mm diameter), a function generator, a voltmeter and an ampere meter. In this setup, field coil is connected in series with an ampere meter which is connected to a function generator to act as an adjustable frequency AC (alternating current) voltage supply. Induction coil is placed inside the field coil and connected to a voltmeter as shown in the picture below. At a fixed frequency of 20 kHz they have changed the applied voltage and recorded readings of the ampere meter and volt meter. With these results they have constructed the graph below and fitted their results to a linear regression and obtained the equation shown in the graph; 320 y = 21.57x + 61.13 R? = 0.98 240 160 80 2 4 8. 10 l6 (mA) Calculate the magnetic constant from these experimental data by utilizing the slope of the given graph and compare your result with theoretical data by calculating error percentage. (nw) Bun

Related questions
Question
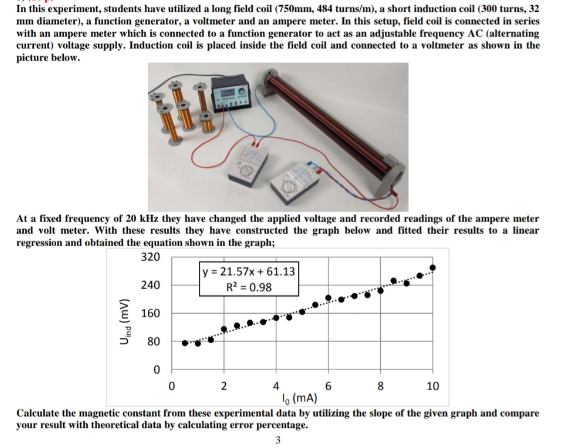
Transcribed Image Text:In this experiment, students have utilized a long field coil (750mm, 484 turns/m), a short induction coil (300 turns, 32
mm diameter), a function generator, a voltmeter and an ampere meter. In this setup, field coil is connected in series
with an ampere meter which is connected to a function generator to act as an adjustable frequency AC (alternating
current) voltage supply. Induction coil is placed inside the field coil and connected to a voltmeter as shown in the
picture below.
At a fixed frequency of 20 kHz they have changed the applied voltage and recorded readings of the ampere meter
and volt meter. With these results they have constructed the graph below and fitted their results to a linear
regression and obtained the equation shown in the graph;
320
y = 21.57x + 61.13
R? = 0.98
240
160
80
2
4
8.
10
l6 (mA)
Calculate the magnetic constant from these experimental data by utilizing the slope of the given graph and compare
your result with theoretical data by calculating error percentage.
(nw) Bun
Expert Solution
This question has been solved!
Explore an expertly crafted, step-by-step solution for a thorough understanding of key concepts.

Step by step
Solved in 4 steps
