In this study researchers investigated the lifespan of animals living in captivity. They gathered data on 30 different species of animals. Lifespan is the age of the species in years. Researchers want to summarize the distribution of lifespans. Graph A Graph B A Madalon O Graph A 10 15 20 cage_number Graph B 25 Which graph is best for summarizing the distribution? 10 10 20 lifespan (years) 30 40
In this study researchers investigated the lifespan of animals living in captivity. They gathered data on 30 different species of animals. Lifespan is the age of the species in years. Researchers want to summarize the distribution of lifespans. Graph A Graph B A Madalon O Graph A 10 15 20 cage_number Graph B 25 Which graph is best for summarizing the distribution? 10 10 20 lifespan (years) 30 40

Glencoe Algebra 1, Student Edition, 9780079039897, 0079039898, 2018
18th Edition
ISBN:9780079039897
Author:Carter
Publisher:Carter
Chapter10: Statistics
Section10.2: Representing Data
Problem 10PPS

Related questions
Question
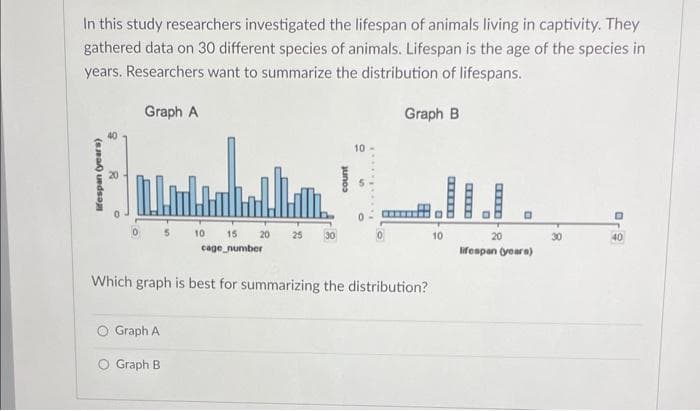
Transcribed Image Text:In this study researchers investigated the lifespan of animals living in captivity. They
gathered data on 30 different species of animals. Lifespan is the age of the species in
years. Researchers want to summarize the distribution of lifespans.
Graph B
Graph A
Funda
15 20
cage_number
Which graph is best for summarizing the distribution?
O Graph A
Graph B
10
10
25
10
20
lifespan (years)
30
40
Expert Solution
This question has been solved!
Explore an expertly crafted, step-by-step solution for a thorough understanding of key concepts.

This is a popular solution!

Trending now
This is a popular solution!

Step by step
Solved in 2 steps

Recommended textbooks for you
Glencoe Algebra 1, Student Edition, 9780079039897…
Algebra
ISBN:
9780079039897
Author:
Carter
Publisher:
McGraw Hill

Holt Mcdougal Larson Pre-algebra: Student Edition…
Algebra
ISBN:
9780547587776
Author:
HOLT MCDOUGAL
Publisher:
HOLT MCDOUGAL
Glencoe Algebra 1, Student Edition, 9780079039897…
Algebra
ISBN:
9780079039897
Author:
Carter
Publisher:
McGraw Hill
Holt Mcdougal Larson Pre-algebra: Student Edition…
Algebra
ISBN:
9780547587776
Author:
HOLT MCDOUGAL
Publisher:
HOLT MCDOUGAL