-) in To graph the function f, we plot the points (x, a coordinate plane. To graph f(x) = x² – 2, we plot the -). So the point (3, . is on the points (x, graph of f. The height of the graph of f above the x-axis when x 3 is. graph of f. Complete the table, and sketch a f(x) (x, y) -2 -1 0 1 2
-) in To graph the function f, we plot the points (x, a coordinate plane. To graph f(x) = x² – 2, we plot the -). So the point (3, . is on the points (x, graph of f. The height of the graph of f above the x-axis when x 3 is. graph of f. Complete the table, and sketch a f(x) (x, y) -2 -1 0 1 2

Algebra & Trigonometry with Analytic Geometry
13th Edition
ISBN:9781133382119
Author:Swokowski
Publisher:Swokowski
Chapter3: Functions And Graphs
Section3.5: Graphs Of Functions
Problem 36E

Related questions
Question
Transcribed Image Text:-) in
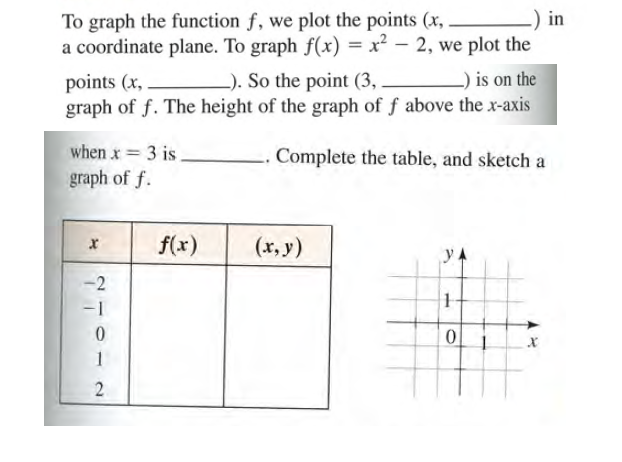
To graph the function f, we plot the points (x,
a coordinate plane. To graph f(x) = x² – 2, we plot the
-). So the point (3, .
is on the
points (x,
graph of f. The height of the graph of f above the x-axis
when x 3 is.
graph of f.
Complete the table, and sketch a
f(x)
(x, y)
-2
-1
0
1
2
Expert Solution
This question has been solved!
Explore an expertly crafted, step-by-step solution for a thorough understanding of key concepts.

This is a popular solution!

Trending now
This is a popular solution!

Step by step
Solved in 2 steps with 1 images

Recommended textbooks for you
Algebra & Trigonometry with Analytic Geometry
Algebra
ISBN:
9781133382119
Author:
Swokowski
Publisher:
Cengage
Algebra & Trigonometry with Analytic Geometry
Algebra
ISBN:
9781133382119
Author:
Swokowski
Publisher:
Cengage