Instructions: Transient analysis is with reference to step response. Peak overshoot is mentioned in per cent. Settling time is to be found out for 2% tolerance. Steady state error is to be computed in absolute magnitude (not in per cent). For frequency response analysis, if the cross-over frequency, the gain margin or the phase margin is unbounded or does not exist, then write the answer for that part as -1. Problem statement: A unity gain negative feedback control system is given with the plant transfer function G(s) = 8(s + 4)2 and a series compensator G_{c}{s)= k, where k>=0. Part A Consider the closed-loop system. 1. Steady state error e_fss) = Using Routh array answer the following: 2. Maximum value of k for stability (kmarginal) = Part B For the control system described in Part A, Choose the value of the gain G_c(s) = k = 64. For the dominant subsystem (of the closed-loop system) obtain the step response and answer the following: 3. Peak time T_p =
Instructions: Transient analysis is with reference to step response. Peak overshoot is mentioned in per cent. Settling time is to be found out for 2% tolerance. Steady state error is to be computed in absolute magnitude (not in per cent). For frequency response analysis, if the cross-over frequency, the gain margin or the phase margin is unbounded or does not exist, then write the answer for that part as -1. Problem statement: A unity gain negative feedback control system is given with the plant transfer function G(s) = 8(s + 4)2 and a series compensator G_{c}{s)= k, where k>=0. Part A Consider the closed-loop system. 1. Steady state error e_fss) = Using Routh array answer the following: 2. Maximum value of k for stability (kmarginal) = Part B For the control system described in Part A, Choose the value of the gain G_c(s) = k = 64. For the dominant subsystem (of the closed-loop system) obtain the step response and answer the following: 3. Peak time T_p =

Power System Analysis and Design (MindTap Course List)
6th Edition
ISBN:9781305632134
Author:J. Duncan Glover, Thomas Overbye, Mulukutla S. Sarma
Publisher:J. Duncan Glover, Thomas Overbye, Mulukutla S. Sarma
Chapter12: Power System Controls
Section: Chapter Questions
Problem 12.1P

Related questions
Question
100%
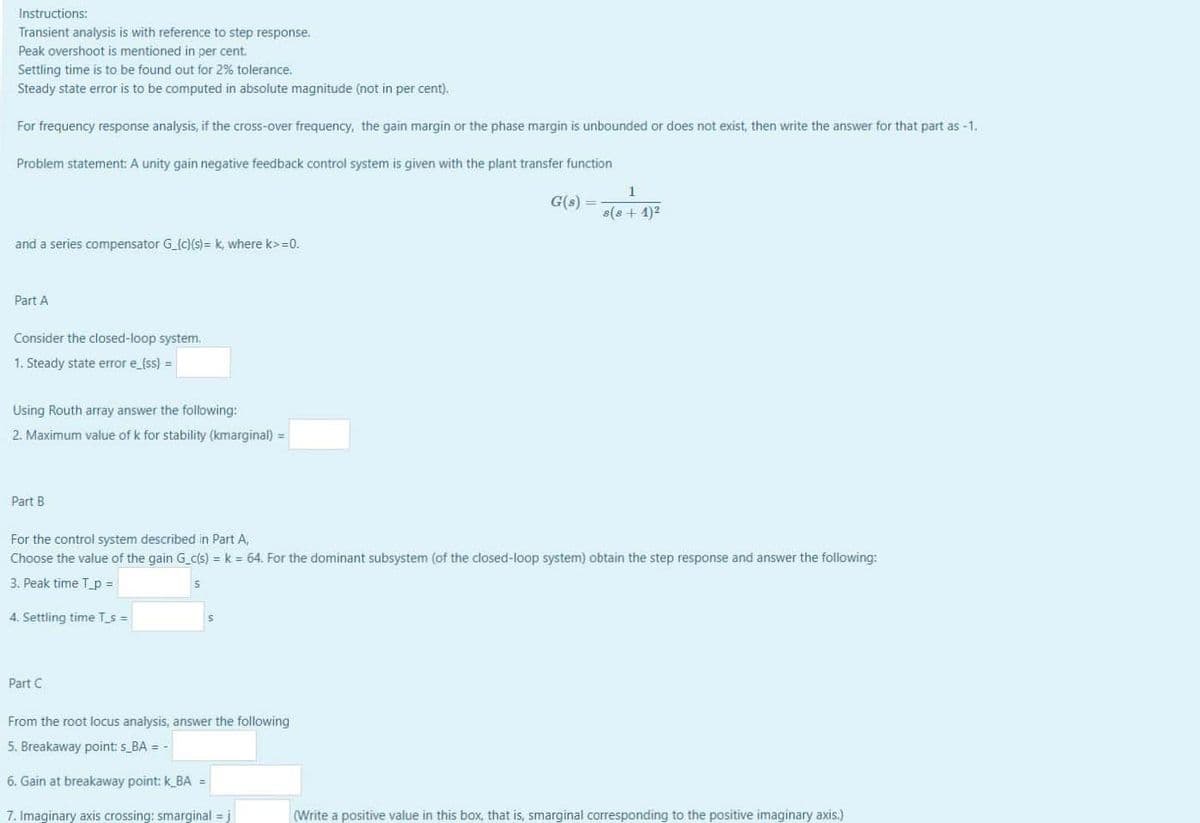
Transcribed Image Text:Instructions:
Transient analysis is with reference to step response.
Peak overshoot is mentioned in per cent.
Settling time is to be found out for 2% tolerance.
Steady state error is to be computed in absolute magnitude (not in per cent).
For frequency response analysis, if the cross-over frequency, the gain margin or the phase margin is unbounded or does not exist, then write the answer for that part as -1.
Problem statement: A unity gain negative feedback control system is given with the plant transfer function
G(s) =
s(8 + 1)2
and a series compensator G_{c}(s)= k, where k>=0.
Part A
Consider the closed-loop system.
1. Steady state error e_{ss) =
Using Routh array answer the following:
2. Maximum value of k for stability (kmarginal) =
Part B
For the control system described in Part A,
Choose the value of the gain G c(s) = k = 64. For the dominant subsystem (of the closed-loop system) obtain the step response and answer the following:
3. Peak time T_p =
4. Settling time T_s =
Part C
From the root locus analysis, answer the following
5. Breakaway point: s_BA = -
6. Gain at breakaway point: k_BA =
7. Imaginary axis crossing: smarginal = j
(Write a positive value in this box, that is, smarginal corresponding to the positive imaginary axis.)
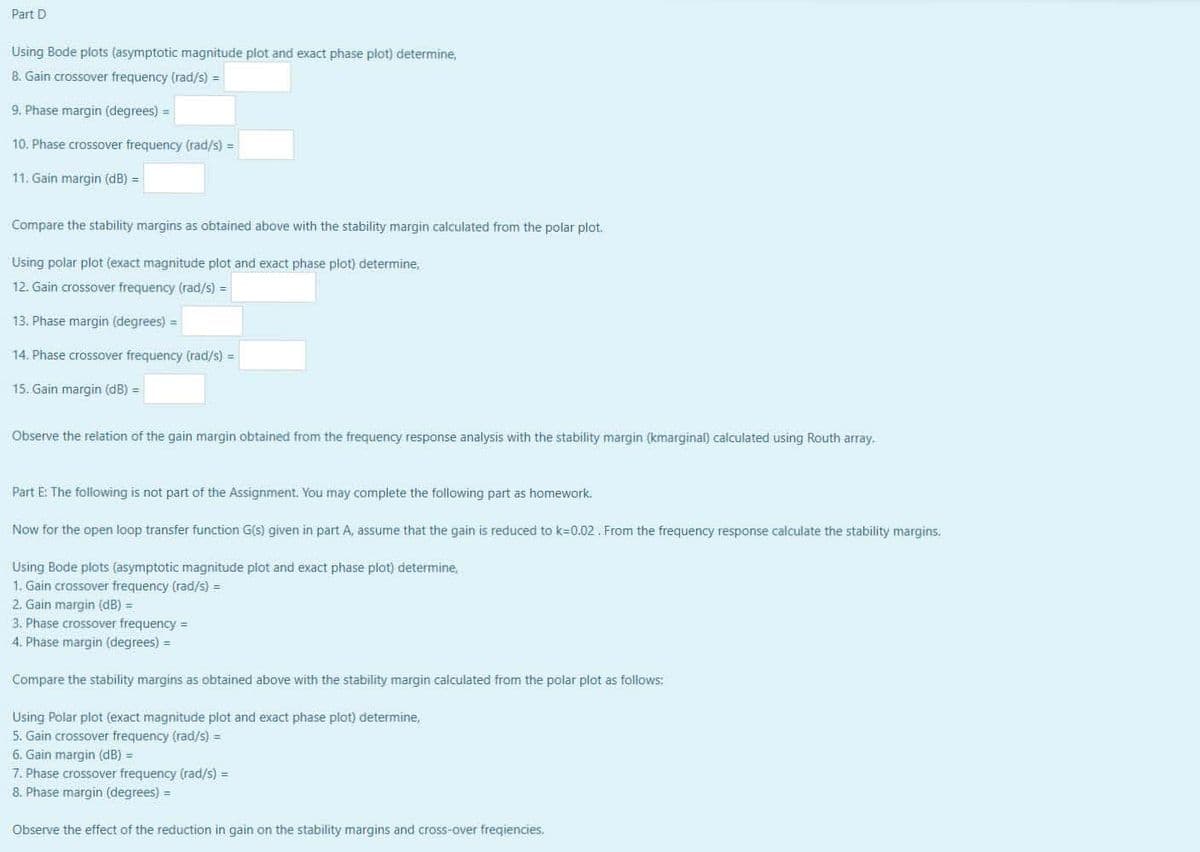
Transcribed Image Text:Part D
Using Bode plots (asymptotic magnitude plot and exact phase plot) determine,
8. Gain crossover frequency (rad/s) =
9. Phase margin (degrees) =
10. Phase crossover frequency (rad/s) =
11. Gain margin (dB) =
Compare the stability margins as obtained above with the stability margin calculated from the polar plot.
Using polar plot (exact magnitude plot and exact phase plot) determine,
12. Gain crossover frequency (rad/s) =
13. Phase margin (degrees) =
14. Phase crossover frequency (rad/s) =
15. Gain margin (dB) =
Observe the relation of the gain margin obtained from the frequency response analysis with the stability margin (kmarginal) calculated using Routh array.
Part E: The following is not part of the Assignment. You may complete the following part as homework.
Now for the open loop transfer function G(s) given in part A, assume that the gain is reduced to k=0.02 . From the frequency response calculate the stability margins.
Using Bode plots (asymptotic magnitude plot and exact phase plot) determine,
1. Gain crossover frequency (rad/s) =
2. Gain margin (dB) =
3. Phase crossover frequency =
4. Phase margin (degrees) =
Compare the stability margins as obtained above with the stability margin calculated from the polar plot as follows:
Using Polar plot (exact magnitude plot and exact phase plot) determine,
5. Gain crossover frequency (rad/s) =
6. Gain margin (dB) =
7. Phase crossover frequency (rad/s) =
8. Phase margin (degrees) =
Observe the effect of the reduction in gain on the stability margins and cross-over freqiencies.
Expert Solution
This question has been solved!
Explore an expertly crafted, step-by-step solution for a thorough understanding of key concepts.

Step by step
Solved in 4 steps

Knowledge Booster


Learn more about
Need a deep-dive on the concept behind this application? Look no further. Learn more about this topic, electrical-engineering and related others by exploring similar questions and additional content below.Recommended textbooks for you
Power System Analysis and Design (MindTap Course …
Electrical Engineering
ISBN:
9781305632134
Author:
J. Duncan Glover, Thomas Overbye, Mulukutla S. Sarma
Publisher:
Cengage Learning
Power System Analysis and Design (MindTap Course …
Electrical Engineering
ISBN:
9781305632134
Author:
J. Duncan Glover, Thomas Overbye, Mulukutla S. Sarma
Publisher:
Cengage Learning