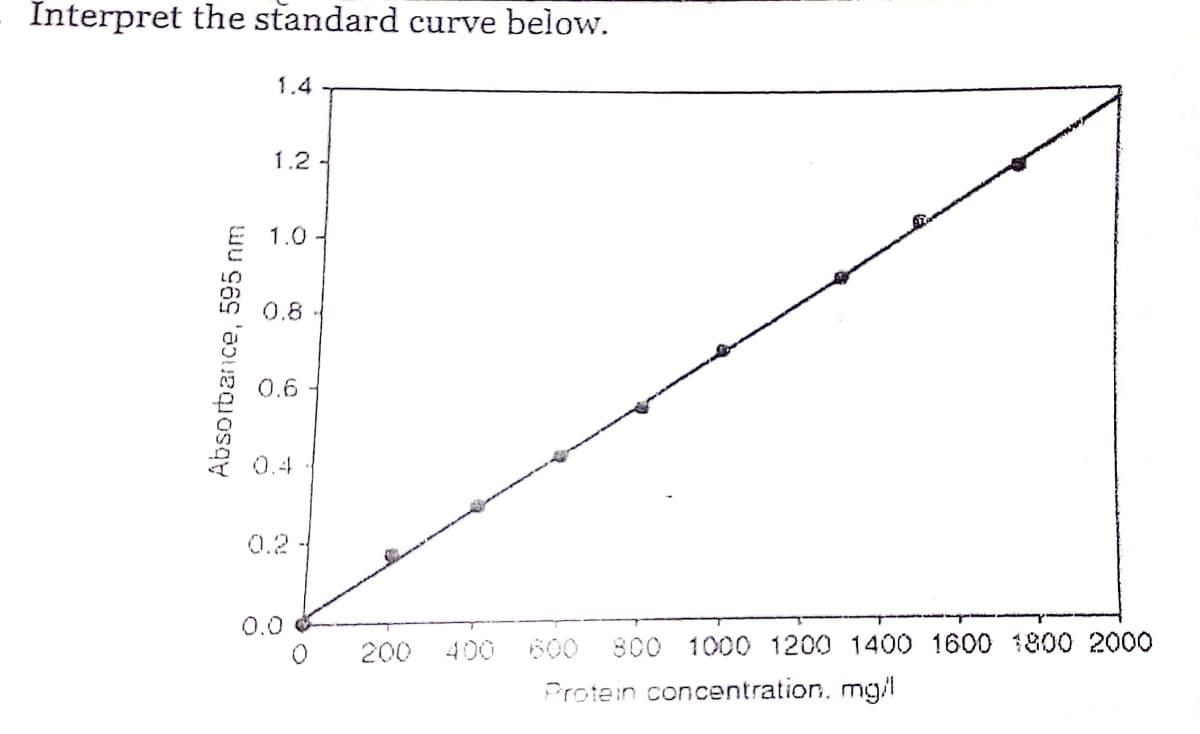
Interpret the standard curve below. 1.4 1.2- 1.0 - 0.8 0.6 0.4 0.2 0.0 200 400 600 800 1000 1200 1400 1600 1800 2000 Protein concentration, mg/I Absorbance, 595 nm


Q: Find Partial Derivatives for z = sin(x)cos(xy)
A:
Q: 1. Determine whether the following series conv. or div. (n+4)! a. Ln=1 4! n! 4n 1 1 b. En=1 4n 2" co...
A:
Q: Consider the following. u = (3, 7), v = (4, 6) %3D (a) Find the projection of u onto v. 27 13 (b) Fi...
A:
Q: Let a. b, and c be three-dimensional vectors. Identify whether the expression a- (b x c) will result...
A: We can solve this as follows:
Q: Find a unit vector e, where v = (4,2, 5) ey = %3D
A:
Q: A person walking along a straight path has her velocity in miles per hour at time t given by the fun...
A: Given: vt=0.25t3-1.5t2+3t+0.25, 0≤t≤2 v(t) is the velocity in miles per hour. t ...
Q: Match the integral expression on the left to its suitable transformation on the right, after using a...
A:
Q: If a1, a2, a3, ..... , an are in AP witn common difference d (where d + 0) then the sum of series : ...
A:
Q: A baseball diamond is a square with side 90 feet. A batter hits the ball and runs toward first base ...
A: Here we have to use the application of derivatives
Q: Find the derivative of the function. (2) = earcsin{z³) f'(z) = Need Help? Read It
A: Given query is to find the derivative of the expression.
Q: Determine whether the two given vectors are orthogonal, parallel, or neither. u = (9,3), v = = (-2, ...
A: We can check whether the two vectors are parallel, orthogonal or neither by definition as below.
Q: Find f'(x) and f"(x). f(x) x2 - 8 f"(x) f"(x)
A:
Q: – sin x show that - In |sec x +c ??? %3D COS X
A:
Q: A rancher plans to fence a rectangular pasture adjacent to a river. The rancher has 125 feet of fenc...
A: Total fencing available is 125 feet.
Q: The intensity of an earthquake can be measured on the Richter scale according to the following logar...
A:
Q: 9) A function that is continuous at x = c must be differentiable at x =c. 10) A function that is di...
A:
Q: Solve the system below using elementary row operations. Show your steps and labels. 2 x + y – z = ...
A:
Q: = csc2 x + sec x Cos° x ,3 -
A: Here f(x) =cosec^2x +secx- cos^3(x)
Q: x = r° +1, y=r -t a) Find dy/dx
A: To find the derivative of given parametric function.
Q: how much should you put in an investmenr paying a simple loan of 5% if you needed $4000 in eighteen ...
A: According to question,Given data,Rate of Interestr = 5%Simple interest = $4000Time = 18 Months
Q: P = (3,7, 3) Q=(9,1,8) Find M, the midpoint of PQ: %3D
A: P=3, 7, 3Q=9, 1, 8To find M, the midpoint of PQ.M=?
Q: The line segment x = p - y,0 <y < p, is revolved about the y-axis to generate the cone as shown in t...
A: Use simple integration formula for lateral surface area.
Q: OA rectangular field is enclosed by on Four sides by a fence. Fencing costs foot för two opposite si...
A:
Q: In a local art museum, a moving spotlight projects geometric figures on the wall in front of it. The...
A: Given that the acute angle connected to the base increases at a rate of 3 degrees per second.
Q: 3 The 9 ft wall shown below stands 30 feet from a building. Find the length of the shortest Straight...
A:
Q: 2 + 5 sede) ( *)) d. /2+5 sed*). 3x 3x 4. 2 + 5 sec e tan
A: 4). Given: I=∫e3x2+5sece3xtane3xdx ...1 As we know that; ∫secxtanxdx=secx+C
Q: nt6 (-1) h
A: Given simplfy
Q: dx cot 3x sin 3x -1/3 sec 3x + C
A: ∫dxcot(3x).sin(3x)=∫dxcos(3x)sin(3x).sin(3x)
Q: Find the exact arc length of y 3 1 over [1, 2]. S 4х - +
A:
Q: Use a double integral in polar coordinates to find the volume V of the solid bounded by the graphs o...
A: This is a problem related to polar integral. Assume the x and y in term of polar and then we will so...
Q: Evaluate the iterated integral by converting to polar coordinates. (Round your answer to four decima...
A: In Polar Coordinate , x= r cosθ and y = r cosθ and dx dy = r dr dθ
Q: Find the derivative of the function. F(t) = e7tsin(2t) 7t sin(21); cos(2t)+7e' 7t sin(21)sin(2t)| F'...
A:
Q: (cos(x) + cos(7x))dx (sin(x)- sin(7x))dx Match the integral expression on the left to an equal expre...
A:
Q: 3. Ranie makes monthly deposits at Php1,500.00 into his savings account that earns interest at 1.5% ...
A: Find your answer below
Q: Give two other polar coordinate representations of the point, one with r 0. (r, 0) = ( 3, – 2.14 X ...
A:
Q: Q2 correct answer
A:
Q: ry" +xy'-4y 2r y"-2y' +y -3-x+x. y(0) =-2, y(0) 1.
A:
Q: xsin-1(x) is If x =0.1 and y = 0.11, then value of C in the antiderivative of F(x) = V1- x?
A:
Q: Find sets of parametric equations and symmetric equations of the line that passes through the given ...
A:
Q: Find the derivative of the following functions. Show complete solutions, including trigonometrie ide...
A:
Q: Find sets of parametric equations and symmetric equations of the line that passes through the given ...
A:
Q: Find the exact area of the surface obtained by rotating the curve y =x' 3 0<x<12, about the y-axis. ...
A:
Q: Find the volume of the solid obtained by rotating the region bounded by y = x - x and y = 0 about th...
A:
Q: ||v|| = 1 %3D ||w|| = 5 %3D The angle between v and w is 1 radians. Given this information, calculat...
A:
Q: Obtain the general solution by separating variables. SHOW YOUR SOLUTIONS. xydx - (x + 2)dy = 0
A: Given problem:- Obtain the general solution by separating variables. SHOW YOUR SOLUTIONS. xydx - (...
Q: Match the integral expression on the left to an equal Prompts Ssin(3x)sin(4x)dx
A:
Q: Find the exact area of the surface obtained by rotating the curve x = 2t +÷,y about the x-axis. Show...
A:
Q: Determine whether the variation model represented by the ordered pairs (x, y) is of the form y = kx ...
A: here it is the y = k/x form and now k = y*x put the value k = 4*1 =4 k = 8*1/2 =4 k 12*1/3 =4 so f...
Q: Find the component form of v given its magnitude and the angle it makes with the positive x-axis. (R...
A:
Q: sec x tanx (1+sec'x)² + sec
A: substitute u= sec3(x)+1 du/dx=3sec3(x)tan(x) dx = du/(3sec3(x)tan(x)) put this in equation 1/3∫ du/...

Step by step
Solved in 2 steps with 1 images

- Use the table of values you made in part 4 of the example to find the limiting value of the average rate of change in velocity.Give an example of a variable that can be used asinstrumentfor the following endogeneity problems. In eachcase,explain why you think this is a good instrument.i.Y = Demand for Ethanol& X =EthanolPriceii.Y = Earnings & X = Leisure TimeClaim: The mean systolic blood pressure of all healthy adults is less than 122 mm Hg. Sample data: For 269 healthy adults, the mean systolic blood pressure level is 121.74 mm Hg and the standard deviation is 15.02 mm Hg. Complete parts (a) and (b). a. Express the original claim in symbolic form. Let the parameter represent a value with respect to systolic blood pressure of a healthy adult.
- In recent years, a substantial amount of research has focused on a possible relationship between chemical contamination of various sorts and mental impairment in children. An article reported data on hair-lead concentration for a sample of mentally impaired children for which the cause of impairment was unknown. Sample statistics were n = 41 X Bar = 16 ppm s = 5.36 ppm The paper states that 14.27 ppm is considered the acceptable upper limit of hair-lead concentration. Let μ= the average hair-lead concentration for all mentally impaired children with the cause of impairment unknown. H0: μ = 14.27 versus H1: μ > 14.27 at 0.01 significance level Does the given sample data support the research hypothesis that true average hair concentration for all such mentally impaired children exceeds the acceptable upper limit? Assume normality. 1. reject null hypothesis 2. fail to reject null hypothesis5. A. Draw a bell-shaped curve and label the axis with the 7 values including the mean of 500 in the center and the other 6 values of 1. 2, and 3 standard deviations away from the mean B. Approximately what percentage of data values fall below 500? C. Approximately what percentage of data values fall between 400 and 600 ? D. Approximately what percentage of data values fall between 300 and 700? E. Approximately what percentage of data values fall between 200 and 800? F. Approximately what percentage of data values fall above 600? G. Approximately what percentage of data values fall below 200? H. Approximately what percentage of data values fall between 400 and 700 ?the test result of SPSS below are of a analysis between two countries. determine the difference between the two countries in terms of temperature change and interpret them
- 1. Prove the following statements:a) The standard deviation is zero if all the observations have some constant value.b) The standard deviation does not change by the change of origin.c) The standard deviation is affected by the change of scale.The MAD for the forecast developed using a weighted 2-year moving average with weights of 0.350.35 and 0.650.65 is what?You are the director of the customer service center in Company Alpha. You find that the meantime between calls to the center is 6 minutes with standard deviation of 4 minutes. The effectiveresponse time is 11 minutes with a standard deviation of 20 minutes.(a) Identify the following parameters:t a: ______________ σa: ______________ ca2: ______________ r a: ______________t e: ______________ σe: ______________ ce2: ______________ r e: ______________(b) Suppose the customer call center has 4 servers who answer calls. Find the following metrics:u: ______________ c d2: ______________(c) Assume that 100% of answered calls are then recorded and immediately monitored for thequality purposes. What is the arrival variability at the Quality Office? Why?c a2: ____________________________________________________________________________________________________________________________________________________________________
- The average life of Canadian women is 73.75 years and the standard deviation of the women's life expectancy in Canada is 6.5 years.Using the Chebyshev's theorem, determine the minimum percentage of women in Canada whose life expectancy is between 64 and 83.5 years.A. 93.17%B. 68.26%C. 55.56%D. 88.89%E. 33.33%Suppose the following model describes changes in the civilian unemployment rate: Δuert = −0.0405 − 0.4674Δuert −1. The current change (first difference) in the un- employment rate is 0.0300. assume that the mean-reverting level for changes in the unemployment rate is −0.0276. a. what is the best prediction of the next change? b. what is the prediction of the change following the next change? C. explain your answer to Part b in terms of equilibrium.In an attempt to reduce the growth of its population, China instituted a policy limiting a familyto one child. Rural Chinese suggested revising the policy to limit families to one son. Assumingthe suggested policy is adopted and that any birth is as likely to produce a boy as a girl, and thesuccessive births are independent, explain the following: (a) What would be the average family size? (b)What would be the ratio of newborn boys to newborn girls?
