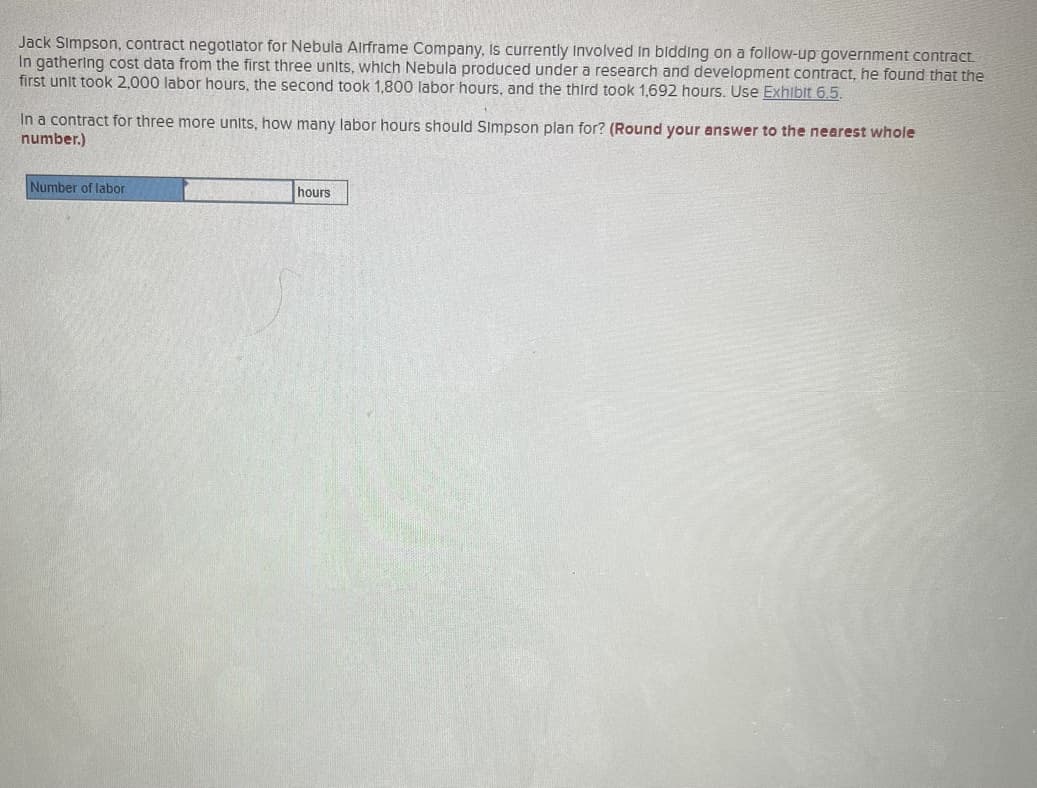
Jack Simpson, contract negotiator for Nebula Airframe Company, is currently involved in bidding on a follow-up government contract. In gathering cost data from the first three units, which Nebula produced under a research and development contract, he found that the first unit took 2,000 labor hours, the second took 1,800 labor hours, and the third took 1,692 hours. Use Exhibit 6.5. In a contract for three more units, how many labor hours should Simpson plan for? (Round your answer to the nearest whole number.) Number of labor hours
Jack Simpson, contract negotiator for Nebula Airframe Company, is currently involved in bidding on a follow-up government contract. In gathering cost data from the first three units, which Nebula produced under a research and development contract, he found that the first unit took 2,000 labor hours, the second took 1,800 labor hours, and the third took 1,692 hours. Use Exhibit 6.5. In a contract for three more units, how many labor hours should Simpson plan for? (Round your answer to the nearest whole number.) Number of labor hours

Practical Management Science
6th Edition
ISBN:9781337406659
Author:WINSTON, Wayne L.
Publisher:WINSTON, Wayne L.
Chapter2: Introduction To Spreadsheet Modeling
Section: Chapter Questions
Problem 20P: Julie James is opening a lemonade stand. She believes the fixed cost per week of running the stand...

Related questions
Question
Ch.6 Q5
Transcribed Image Text:Jack Simpson, contract negotiator for Nebula Airframe Company, Is currently involved in bidding on a follow-up government contract.
In gathering cost data from the first three units, which Nebula produced under a research and development contract, he found that the
first unit took 2,000 labor hours, the second took 1,800 labor hours, and the third took 1,692 hours. Use Exhibit 6.5.
In a contract for three more units, how many labor hours should Simpson plan for? (Round your answer to the nearest whole
number.)
Number of labor
hours
Transcribed Image Text:Exhibit 6.5
Unit
1
2
3
4
5
6
7
8
9
10
12
14
16
18
20
22
24
25
30
35
40
45
50
60
70
80
90
100
120
140
160
180
200
250
300
350
400
450
500
600
700
800
900
1,000
1.200
1,400
1,600
1,800
2.000
2.500
3,000
60%
1.000
1.600
4.946
5.171
5.379
5.574
5.668
6.097
6.478
6.821
7.134
7.422
7.941
8401
8814
2.045
2.405
2,710
2.946
2.977
3.274
3216 3572
3.432
3.847
3.630
4.102
3813 4341
4.144
4.790
4438
5.177
4.704
5.541
5.879
6.195
6.492
6.773
6.909
9.191
9.539
10.16
10.72
11.21:
11.67
12.09
13.01
13.81
14.51
15.14
15.72
16.26
17.21
18.06
18.82
19.51
20.15
21.30
22.32
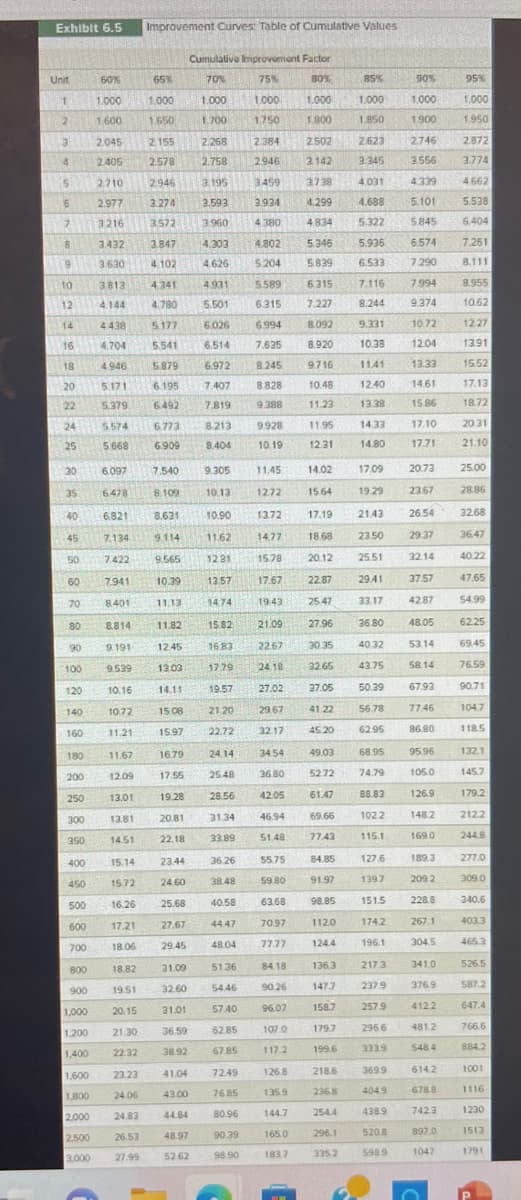
Improvement Curves: Table of Cumulative Values
23.23
24.06
24.83
26.53
27.99
65%
1.000
1.650
2.155
2.578
7,540
8.109
8.631
9.114
9.565
10.39
11.13
11.82
12.45
13.03
14.11
15.08
15.97
16.79
17.55
19.28
20.81
22.18
23.44
24.60
25.68
27.67
29.45
31.09
32.60
31.01
36.59
38.92
41.04
43.00
44.84
48.97
52.62
Cumulative Improvement Factor
70%
75%
1.000
1.000
1.700
1.750
2.268
2.758
2.384
2946
3,195
3459
3.593
3.934
3.960 4.380
4,303
4.802
4.626
5:204
4.931
5.501
6.026
6.514
6.972
7.407
7.819
8.213
8.404
9.305
10.13
10.90
11.62
12.31
13.57
1474
15.82
16.83
17.79
19.57
21,20
22.72
24.14
25.48
28.56
31.34
33.89
36.26
38.48
40.58
44.47
48.04
51.36
54.46
57.40
62.85
67.85
72.49
76.85
80.96
90.39
98.90
9928
10.19
3738
4.299
4.834
5,346
5.839
5.589
6.315
6.315 7.227
6.994
7.635
8.245
8.828
9.388
11.45
12.72
13.72
14.77
15.78
17.67
19:43
21.09
22.67
24.18
27.02
29,67
32.17
34.54
36 80
42.05
46.94
51.48
55.75
59.80
63.68
70.97
77.77
84.18
90.26
96.07
107.0
117.2
80%
1.000
1.800
126.8
135.9
144.7
165.0
183.7
2.502
3.142
8.092
8.920
9.716
10.48
11.23
11.95
12.31
14.02
15.64
17.19
18.68
20.12
22.87
25.47
27.96
30.35
32.65
37.05
41.22
45.20
49.03
52.72
61.47
69.66
77.43
84.85
91.97
98.85
112.0
124.4
136.3
147.3
158.7
1797
199.6
218.6
236.8
254.4
296.1
335.2
85%
1.000
1.850
2.623
3.345
4.031
4.688
5.322
5.936
6.533
7.116
8.244
9.331
10.38
11.41
12:40
13.38
14.33
14.80
17.09
19.29
21.43
23.50
25.51
29.41
33.17
36.80
40.32
43.75
50.39
56.78
62.95
68.95
74.79
88.83
102.2
115.1
127.6
139.7
151.5
174.2
196.1
217.3
237.9
257.9
296.6
3339
369.9
4049
438.9
520.8
5989
90%
1.000
1900
2.746
3.556
4.339
5.101
5845
6.574
7.290
7.994
9.374
10.72
12.04
13.33
14.61
15.86
17.10
17.71
20.73
23.67
26.54
29.37
32.14
37.57
42.87
48.05
53.14
58.14
67.93
77.46
86.80
95.96
105.0
126.9
148.2
169.0
189.3
209 2
228.8
267.1
304.5
341.0
376.9
4122
481.2
548.4
614.2
678.8
742.3
897.0
1047
O
95%
1.000
1.950
2.872
3.774
4.662
5.538
6.404
7.261
8.111
8.955
10.62
12.27
13.91
15.52
17.13
18.72
20.31
21.10
25.00
28.86
32.68
36.47
40.22
47.65
54.99
62.25
69.45
76.59
90.71
104.7
118.5
132.1
145.7
179.2
212.2
244.8
277.0
309.0
340.6
403.3
465.3
526.5
587.2
647.4
766.6
884.2
1001
1116
1230
1513
1791
P
Expert Solution
This question has been solved!
Explore an expertly crafted, step-by-step solution for a thorough understanding of key concepts.

This is a popular solution!

Trending now
This is a popular solution!

Step by step
Solved in 2 steps

Recommended textbooks for you
Practical Management Science
Operations Management
ISBN:
9781337406659
Author:
WINSTON, Wayne L.
Publisher:
Cengage,

Operations Management
Operations Management
ISBN:
9781259667473
Author:
William J Stevenson
Publisher:
McGraw-Hill Education

Operations and Supply Chain Management (Mcgraw-hi…
Operations Management
ISBN:
9781259666100
Author:
F. Robert Jacobs, Richard B Chase
Publisher:
McGraw-Hill Education
Practical Management Science
Operations Management
ISBN:
9781337406659
Author:
WINSTON, Wayne L.
Publisher:
Cengage,
Operations Management
Operations Management
ISBN:
9781259667473
Author:
William J Stevenson
Publisher:
McGraw-Hill Education
Operations and Supply Chain Management (Mcgraw-hi…
Operations Management
ISBN:
9781259666100
Author:
F. Robert Jacobs, Richard B Chase
Publisher:
McGraw-Hill Education


Purchasing and Supply Chain Management
Operations Management
ISBN:
9781285869681
Author:
Robert M. Monczka, Robert B. Handfield, Larry C. Giunipero, James L. Patterson
Publisher:
Cengage Learning

Production and Operations Analysis, Seventh Editi…
Operations Management
ISBN:
9781478623069
Author:
Steven Nahmias, Tava Lennon Olsen
Publisher:
Waveland Press, Inc.