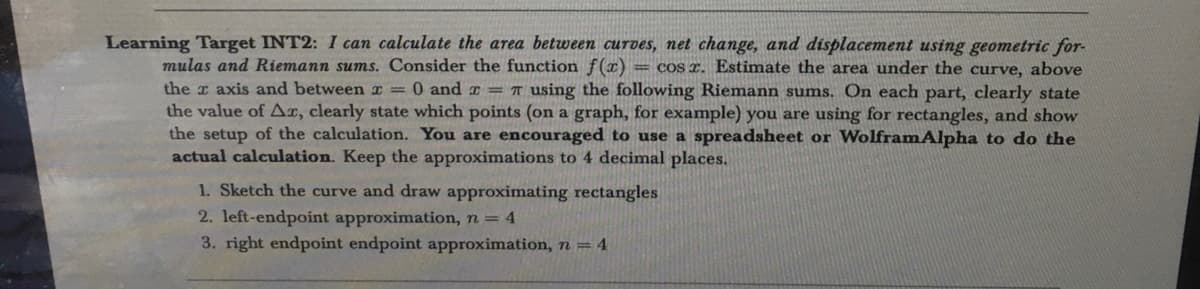
Learning Target INT2: I can calculate the area between curves, net change, and displacement using geometric for- mulas and Riemann sums. Consider the function f(x) = cos z. Estimate the area under the curve, above the r axis and between x = 0 and = 7 using the following Riemann sums. On each part, clearly state the value of Ax, clearly state which points (on a graph, for example) you are using for rectangles, and show the setup of the calculation. You are encouraged to use a spreadsheet or Wolfram Alpha to do the actual calculation. Keep the approximations to 4 decimal places. 1. Sketch the curve and draw approximating rectangles 2. left-endpoint approximation, n = 4 3. right endpoint endpoint approximation, n = 4
Learning Target INT2: I can calculate the area between curves, net change, and displacement using geometric for- mulas and Riemann sums. Consider the function f(x) = cos z. Estimate the area under the curve, above the r axis and between x = 0 and = 7 using the following Riemann sums. On each part, clearly state the value of Ax, clearly state which points (on a graph, for example) you are using for rectangles, and show the setup of the calculation. You are encouraged to use a spreadsheet or Wolfram Alpha to do the actual calculation. Keep the approximations to 4 decimal places. 1. Sketch the curve and draw approximating rectangles 2. left-endpoint approximation, n = 4 3. right endpoint endpoint approximation, n = 4

Trigonometry (MindTap Course List)
10th Edition
ISBN:9781337278461
Author:Ron Larson
Publisher:Ron Larson
Chapter1: Trigonometry
Section1.7: Inverse Trigonometric Functions
Problem 127E

Related questions
Question
Transcribed Image Text:Learning Target INT2: I can calculate the area between curves, net change, and displacement using geometric for-
mulas and Riemann sums. Consider the function f(x) = cos z. Estimate the area under the curve, above
the r axis and between x = 0 and = 7 using the following Riemann sums. On each part, clearly state
the value of Ax, clearly state which points (on a graph, for example) you are using for rectangles, and show
the setup of the calculation. You are encouraged to use a spreadsheet or WolframAlpha to do the
actual calculation. Keep the approximations to 4 decimal places.
1. Sketch the curve and draw approximating rectangles
2. left-endpoint approximation, n = 4
3. right endpoint endpoint approximation, n = 4
Expert Solution
This question has been solved!
Explore an expertly crafted, step-by-step solution for a thorough understanding of key concepts.

Step by step
Solved in 3 steps with 1 images

Recommended textbooks for you
Trigonometry (MindTap Course List)
Trigonometry
ISBN:
9781337278461
Author:
Ron Larson
Publisher:
Cengage Learning

Functions and Change: A Modeling Approach to Coll…
Algebra
ISBN:
9781337111348
Author:
Bruce Crauder, Benny Evans, Alan Noell
Publisher:
Cengage Learning
Trigonometry (MindTap Course List)
Trigonometry
ISBN:
9781337278461
Author:
Ron Larson
Publisher:
Cengage Learning
Functions and Change: A Modeling Approach to Coll…
Algebra
ISBN:
9781337111348
Author:
Bruce Crauder, Benny Evans, Alan Noell
Publisher:
Cengage Learning