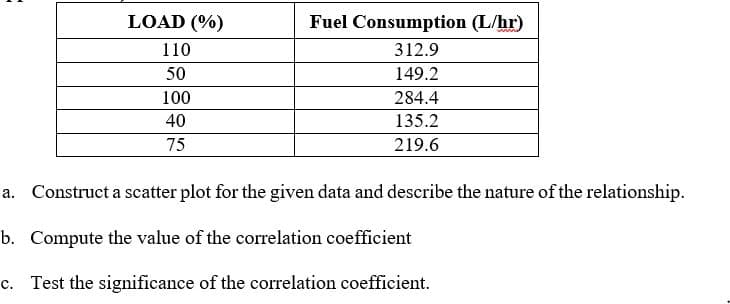
LOAD (%) Fuel Consumption (L/hr) 110 312.9 50 149.2 100 284.4 40 135.2 75 219.6 . Construct a scatter plot for the given data and describe the nature of the relationship. . Compute the value of the correlation coefficient . Test the significance of the correlation coefficient.
LOAD (%) Fuel Consumption (L/hr) 110 312.9 50 149.2 100 284.4 40 135.2 75 219.6 . Construct a scatter plot for the given data and describe the nature of the relationship. . Compute the value of the correlation coefficient . Test the significance of the correlation coefficient.
Refrigeration and Air Conditioning Technology (MindTap Course List)
8th Edition
ISBN:9781305578296
Author:John Tomczyk, Eugene Silberstein, Bill Whitman, Bill Johnson
Publisher:John Tomczyk, Eugene Silberstein, Bill Whitman, Bill Johnson
Chapter39: Residential Energy Auditing
Section: Chapter Questions
Problem 15RQ: When performing a combustion efficiency test, digital flue gas will measure what four...
Related questions
Question

Transcribed Image Text:LOAD (%)
Fuel Consumption (L/hr)
110
312.9
50
149.2
100
284.4
40
135.2
75
219.6
a. Construct a scatter plot for the given data and describe the nature of the relationship.
b. Compute the value of the correlation coefficient
c. Test the significance of the correlation coefficient.
Expert Solution
This question has been solved!
Explore an expertly crafted, step-by-step solution for a thorough understanding of key concepts.
Step by step
Solved in 2 steps with 2 images

Knowledge Booster
Learn more about
Need a deep-dive on the concept behind this application? Look no further. Learn more about this topic, mechanical-engineering and related others by exploring similar questions and additional content below.Recommended textbooks for you

Refrigeration and Air Conditioning Technology (Mi…
Mechanical Engineering
ISBN:
9781305578296
Author:
John Tomczyk, Eugene Silberstein, Bill Whitman, Bill Johnson
Publisher:
Cengage Learning

Refrigeration and Air Conditioning Technology (Mi…
Mechanical Engineering
ISBN:
9781305578296
Author:
John Tomczyk, Eugene Silberstein, Bill Whitman, Bill Johnson
Publisher:
Cengage Learning