Loblolly is a built-in R dataset that that records the growth of Loblolly pine trees. We are interested in the height column of Loblolly. The values in the height column can be converted into a vector of name x by the assignment: x <- Loblolly$height We can see the values in x by typing x and Return or Enter. Remember x <- Loblolly$height After this assignment, we can see the first six values in x by typing head(x) and Return or Enter a.Give the R code to assign the values in in the height column of Loblolly to the vector named x. (Easy-see above) b. Calculate the interquartile range of x using the R, IQR() function. c. Calculate the sum of the squares of the values in x. [ d. Calculate the sample mean of x. e. Calculate the sample variance of x. [ f. Calculate the sample standard deviation of x. f. Using R, calculate a trimmed mean of x. 84 h.Enter your R script in the box below.
Loblolly is a built-in R dataset that that records the growth of Loblolly pine trees. We are interested in the height column of Loblolly. The values in the height column can be converted into a vector of name x by the assignment: x <- Loblolly$height We can see the values in x by typing x and Return or Enter. Remember x <- Loblolly$height After this assignment, we can see the first six values in x by typing head(x) and Return or Enter a.Give the R code to assign the values in in the height column of Loblolly to the vector named x. (Easy-see above) b. Calculate the interquartile range of x using the R, IQR() function. c. Calculate the sum of the squares of the values in x. [ d. Calculate the sample mean of x. e. Calculate the sample variance of x. [ f. Calculate the sample standard deviation of x. f. Using R, calculate a trimmed mean of x. 84 h.Enter your R script in the box below.

Algebra & Trigonometry with Analytic Geometry
13th Edition
ISBN:9781133382119
Author:Swokowski
Publisher:Swokowski
Chapter8: Applications Of Trigonometry
Section8.4: The Dot Product
Problem 45E

Related questions
Question
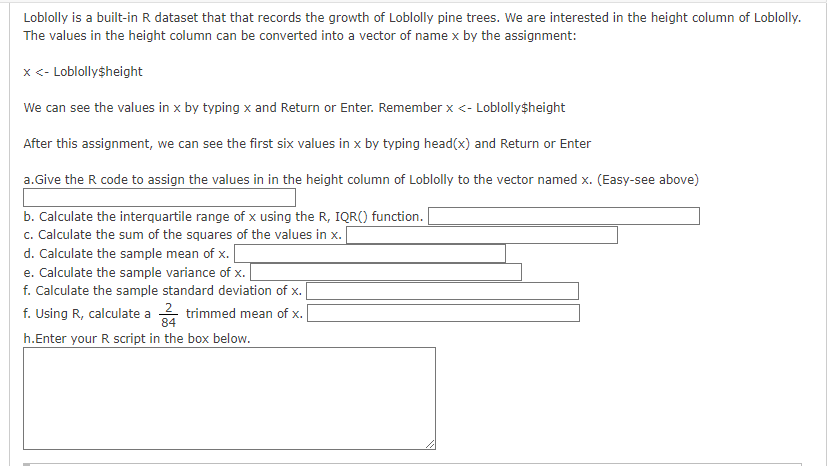
Transcribed Image Text:Loblolly is a built-in R dataset that that records the growth of Loblolly pine trees. We are interested in the height column of Loblolly.
The values in the height column can be converted into a vector of name x by the assignment:
x <- Loblolly$height
We can see the values in x by typing x and Return or Enter. Remember x <- Loblolly$height
After this assignment, we can see the first six values in x by typing head(x) and Return or Enter
a. Give the R code to assign the values in in the height column of Loblolly to the vector named x. (Easy-see above)
b. Calculate the interquartile range of x using the R, IQR() function.
c. Calculate the sum of the squares of the values in x.
d. Calculate the sample mean of x.
e. Calculate the sample variance of x.
f. Calculate the sample standard deviation of x.
f. Using R, calculate a
trimmed mean of x. [
h.Enter your R script in the box below.
Expert Solution
This question has been solved!
Explore an expertly crafted, step-by-step solution for a thorough understanding of key concepts.

This is a popular solution!

Trending now
This is a popular solution!

Step by step
Solved in 2 steps with 1 images

Recommended textbooks for you
Algebra & Trigonometry with Analytic Geometry
Algebra
ISBN:
9781133382119
Author:
Swokowski
Publisher:
Cengage

Linear Algebra: A Modern Introduction
Algebra
ISBN:
9781285463247
Author:
David Poole
Publisher:
Cengage Learning

Elementary Linear Algebra (MindTap Course List)
Algebra
ISBN:
9781305658004
Author:
Ron Larson
Publisher:
Cengage Learning
Algebra & Trigonometry with Analytic Geometry
Algebra
ISBN:
9781133382119
Author:
Swokowski
Publisher:
Cengage
Linear Algebra: A Modern Introduction
Algebra
ISBN:
9781285463247
Author:
David Poole
Publisher:
Cengage Learning
Elementary Linear Algebra (MindTap Course List)
Algebra
ISBN:
9781305658004
Author:
Ron Larson
Publisher:
Cengage Learning