long the y-axis. Is the graph linear? If so, use a linear fit and write down thebequation of the best-fit straight line. If not, use a power law fit of y = xn. What is the value of n? Based on the fit, are the variables directly or inversely proportional? Temperature T (K) Pressure 300 35.1 350 40.

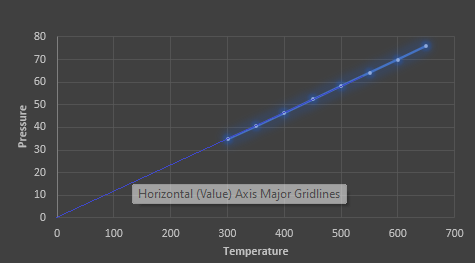
a.Plot P vs T graph for the constant V using Excel. Choose the independent variable T along the x-axis and P along the y-axis. Is the graph linear? If so, use a linear fit and write down thebequation of the best-fit straight line. If not, use a power law fit of y = xn. What is the value of n? Based on the fit, are the variables directly or inversely proportional?
| Temperature T (K) | Pressure |
| 300 | 35.1 |
| 350 | 40.7 |
| 400 | 46.5 |
| 450 | 52.4 |
| 500 | 58.3 |
| 550 | 64.1 |
| 600 | 69.9 |
| 650 | 75.8 |
b.Plot P vs. V graph for constant T using Excel. Choose the independent variable w (for V, which is ~ w) along the x-axis and P along the y-axis. Is the graph linear? If so, use a linear fit and write down the equation of the straight-line fit. If not, use a power law fit of y = xn. What is the value of n? What does it say about the relation between pressure and volume of a gas at constant temperature? Are the variables directly or inversely proportional?
| Width | Pressure |
| 10 | 75.8 |
| 10.5 | 72.1 |
| 11.5 | 65.6 |
| 12 | 63.3 |
| 13 | 58.5 |
| 13.5 | 56.4 |
| 14 | 54.4 |
| 15 | 50.7 |
Solution:
a). The temperature versus pressure has been plotted using excel as shown below.

Step by step
Solved in 5 steps with 3 images
