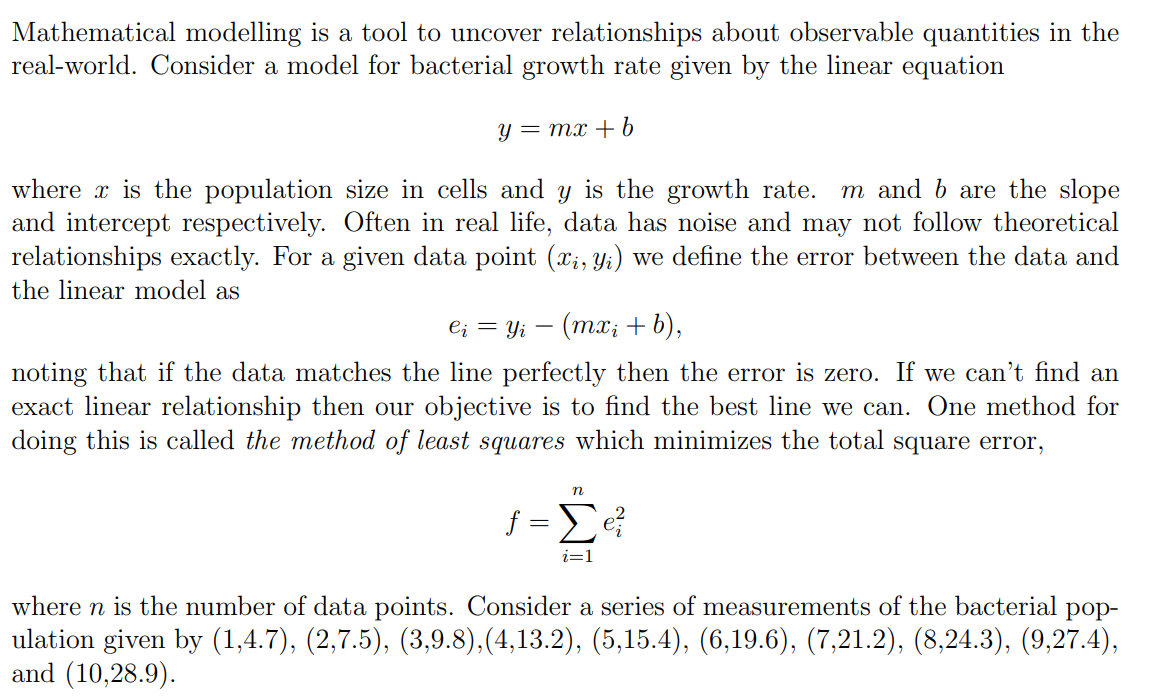
Mathematical modelling is a tool to uncover relationships about observable quantities in the real-world. Consider a model for bacterial growth rate given by the linear equation y = mx + b where is the population size in cells and y is the growth rate. m and b are the slope and intercept respectively. Often in real life, data has noise and may not follow theoretical relationships exactly. For a given data point (x, y) we define the error between the data and the linear model as eį = Yi − (mxį + b), - noting that if the data matches the line perfectly then the error is zero. If we can't find an exact linear relationship then our objective is to find the best line we can. One method for doing this is called the method of least squares which minimizes the total square error, n f=Σe? i=1 where n is the number of data points. Consider a series of measurements of the bacterial pop- ulation given by (1,4.7), (2,7.5), (3,9.8),(4,13.2), (5,15.4), (6,19.6), (7,21.2), (8,24.3), (9,27.4), and (10.28.9).
Mathematical modelling is a tool to uncover relationships about observable quantities in the real-world. Consider a model for bacterial growth rate given by the linear equation y = mx + b where is the population size in cells and y is the growth rate. m and b are the slope and intercept respectively. Often in real life, data has noise and may not follow theoretical relationships exactly. For a given data point (x, y) we define the error between the data and the linear model as eį = Yi − (mxį + b), - noting that if the data matches the line perfectly then the error is zero. If we can't find an exact linear relationship then our objective is to find the best line we can. One method for doing this is called the method of least squares which minimizes the total square error, n f=Σe? i=1 where n is the number of data points. Consider a series of measurements of the bacterial pop- ulation given by (1,4.7), (2,7.5), (3,9.8),(4,13.2), (5,15.4), (6,19.6), (7,21.2), (8,24.3), (9,27.4), and (10.28.9).

Functions and Change: A Modeling Approach to College Algebra (MindTap Course List)
6th Edition
ISBN:9781337111348
Author:Bruce Crauder, Benny Evans, Alan Noell
Publisher:Bruce Crauder, Benny Evans, Alan Noell
Chapter3: Straight Lines And Linear Functions
Section3.3: Modeling Data With Linear Functions
Problem 1E: Employee Turnover The percentage of employees who cease their employment during a year is referred...

Related questions
Question
Transcribed Image Text:Mathematical modelling is a tool to uncover relationships about observable quantities in the
real-world. Consider a model for bacterial growth rate given by the linear equation
y = mx + b
where is the population size in cells and y is the growth rate. m and b are the slope
and intercept respectively. Often in real life, data has noise and may not follow theoretical
relationships exactly. For a given data point (x₁, y₁) we define the error between the data and
the linear model as
eį = y₁ − (mx; + b),
-
noting that if the data matches the line perfectly then the error is zero. If we can't find an
exact linear relationship then our objective is to find the best line we can. One method for
doing this is called the method of least squares which minimizes the total square error,
n
f=Σe ²
i=1
where n is the number of data points. Consider a series of measurements of the bacterial pop-
ulation given by (1,4.7), (2,7.5), (3,9.8),(4,13.2), (5,15.4), (6,19.6), (7,21.2), (8,24.3), (9,27.4),
and (10,28.9).
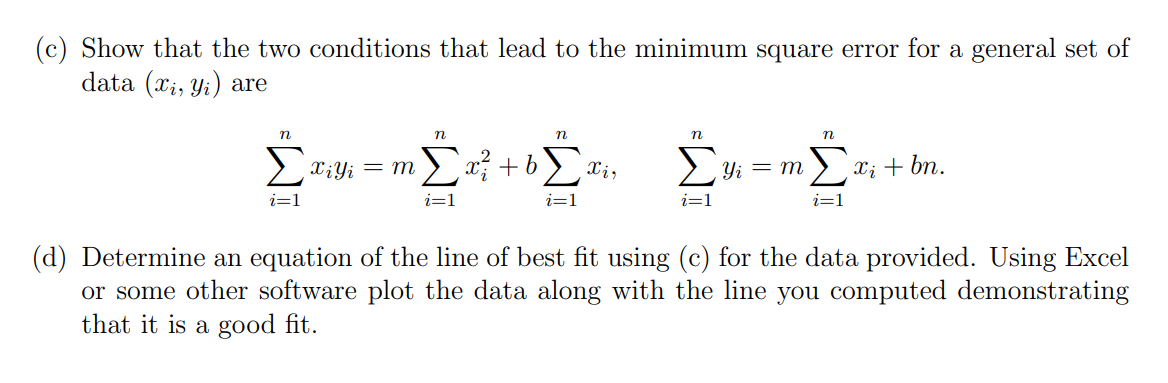
Transcribed Image Text:(c) Show that the two conditions that lead to the minimum square error for a general set of
data (xi, yi) are
n
ΣΤΑΣΗΣ ΣΥΣ
Xi Yi
m
Συ+Σ Xi,
i=1
n
i=1
n
i=1
η
η
yi = m Ex; + bn.
i=1
(d) Determine an equation of the line of best fit using (c) for the data provided. Using Excel
or some other software plot the data along with the line you computed demonstrating
that it is a good fit.
Expert Solution
This question has been solved!
Explore an expertly crafted, step-by-step solution for a thorough understanding of key concepts.

Step by step
Solved in 8 steps with 2 images

Recommended textbooks for you
Functions and Change: A Modeling Approach to Coll…
Algebra
ISBN:
9781337111348
Author:
Bruce Crauder, Benny Evans, Alan Noell
Publisher:
Cengage Learning

Algebra & Trigonometry with Analytic Geometry
Algebra
ISBN:
9781133382119
Author:
Swokowski
Publisher:
Cengage

Glencoe Algebra 1, Student Edition, 9780079039897…
Algebra
ISBN:
9780079039897
Author:
Carter
Publisher:
McGraw Hill
Functions and Change: A Modeling Approach to Coll…
Algebra
ISBN:
9781337111348
Author:
Bruce Crauder, Benny Evans, Alan Noell
Publisher:
Cengage Learning
Algebra & Trigonometry with Analytic Geometry
Algebra
ISBN:
9781133382119
Author:
Swokowski
Publisher:
Cengage
Glencoe Algebra 1, Student Edition, 9780079039897…
Algebra
ISBN:
9780079039897
Author:
Carter
Publisher:
McGraw Hill

Big Ideas Math A Bridge To Success Algebra 1: Stu…
Algebra
ISBN:
9781680331141
Author:
HOUGHTON MIFFLIN HARCOURT
Publisher:
Houghton Mifflin Harcourt