Median Women's Earnings as a Percentage of Median Men's Earnings in the United States The Graph of a Function Modeling the Data 85 83% 85- 8아아 80 76% 75 75 71% 70 70 65 65- G[x) = -0.01x + x + 60 60% 60 60 55 55 1980 1990 2000 2010 5 10 15 20 25 30 Year Years after 1980 Wage Gap (percent) Wage Gap (perent)


Contingency Table
A contingency table can be defined as the visual representation of the relationship between two or more categorical variables that can be evaluated and registered. It is a categorical version of the scatterplot, which is used to investigate the linear relationship between two variables. A contingency table is indeed a type of frequency distribution table that displays two variables at the same time.
Binomial Distribution
Binomial is an algebraic expression of the sum or the difference of two terms. Before knowing about binomial distribution, we must know about the binomial theorem.
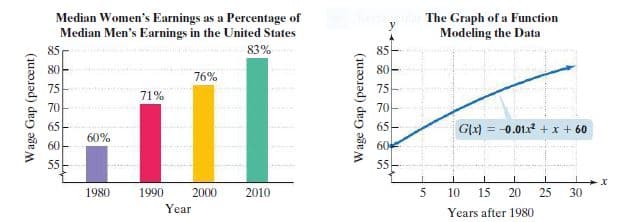
The bar graph shows the wage gap for selected years from 1980 through 2010.The function G(x) = -0.01x2 + x + 60 models the wage gap, as a percent, x years after 1980. .
a. Find and interpret G(30). Identify this information as a point on the graph of the function.
b. Does G(30) overestimate or underestimate the actual data shown by the bar graph? By how much?


Trending now
This is a popular solution!

Step by step
Solved in 2 steps


