Milk production M (in billions of pounds) in the United States from 2010 through 2018 can be modeled by M = 3.125t + 161.93, 10 ≤ t ≤ 18, where t represents the year, with t = 10 corresponding to 2010.T (a) According to the model, when was the annual milk production greater than 200 billion pounds but no more than 210 billion pounds? O 13.78 < t ≤ 16.98 (between 2013 and 2016) O 13.38 < t ≤ 16.58 (between 2013 and 2016) O 12.18 < t ≤ 15.38 (between 2012 and 2015) O 13.98 < t ≤ 17.18 (between 2013 and 2017) 10.88 < t ≤ 14.08 (between 2010 and 2014) (b) Use the model to determine when milk production exceeded 216 billion pounds. Ot> 16 (2016) t> 17.30 (2017) Ot> 18.9 (2018) Ot> 18.5 (2018) Ot> 19.1 (2019) Need Help? [ Read It
Milk production M (in billions of pounds) in the United States from 2010 through 2018 can be modeled by M = 3.125t + 161.93, 10 ≤ t ≤ 18, where t represents the year, with t = 10 corresponding to 2010.T (a) According to the model, when was the annual milk production greater than 200 billion pounds but no more than 210 billion pounds? O 13.78 < t ≤ 16.98 (between 2013 and 2016) O 13.38 < t ≤ 16.58 (between 2013 and 2016) O 12.18 < t ≤ 15.38 (between 2012 and 2015) O 13.98 < t ≤ 17.18 (between 2013 and 2017) 10.88 < t ≤ 14.08 (between 2010 and 2014) (b) Use the model to determine when milk production exceeded 216 billion pounds. Ot> 16 (2016) t> 17.30 (2017) Ot> 18.9 (2018) Ot> 18.5 (2018) Ot> 19.1 (2019) Need Help? [ Read It

Algebra & Trigonometry with Analytic Geometry
13th Edition
ISBN:9781133382119
Author:Swokowski
Publisher:Swokowski
Chapter4: Polynomial And Rational Functions
Section4.6: Variation
Problem 9E

Related questions
Question
5.214!
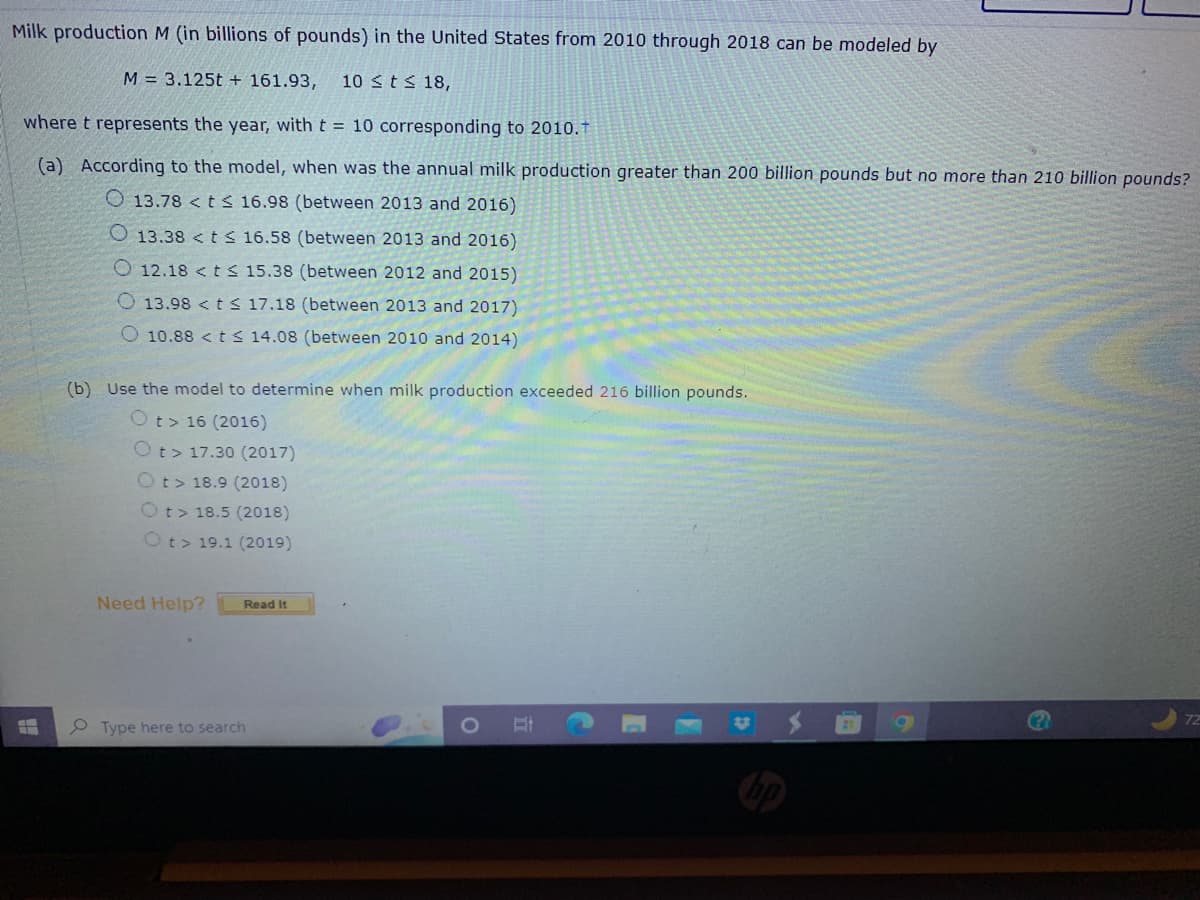
Transcribed Image Text:Milk production M (in billions of pounds) in the United States from 2010 through 2018 can be modeled by
M = 3.125t + 161.93, 10 ≤ t ≤ 18,
where t represents the year, with t = 10 corresponding to 2010.†
(a) According to the model, when was the annual milk production greater than 200 billion pounds but no more than 210 billion pounds?
O 13.78 < t ≤ 16.98 (between 2013 and 2016)
#
O 13.38 < t ≤ 16.58 (between 2013 and 2016)
15.38 (between 2012 and 2015)
O 12.18 < t ≤
13.98 < t ≤ 17.18 (between 2013 and 2017)
10.88 < t ≤ 14.08 (between 2010 and 2014)
(b) Use the model to determine when milk production exceeded 216 billion pounds.
Ot> 16 (2016)
t> 17.30 (2017)
Ot> 18.9 (2018)
Ot> 18.5 (2018)
Ot> 19.1 (2019)
Need Help? Read It
Type here to search
O
Bi
72
Expert Solution
This question has been solved!
Explore an expertly crafted, step-by-step solution for a thorough understanding of key concepts.

Step by step
Solved in 3 steps with 2 images

Recommended textbooks for you
Algebra & Trigonometry with Analytic Geometry
Algebra
ISBN:
9781133382119
Author:
Swokowski
Publisher:
Cengage
Algebra & Trigonometry with Analytic Geometry
Algebra
ISBN:
9781133382119
Author:
Swokowski
Publisher:
Cengage