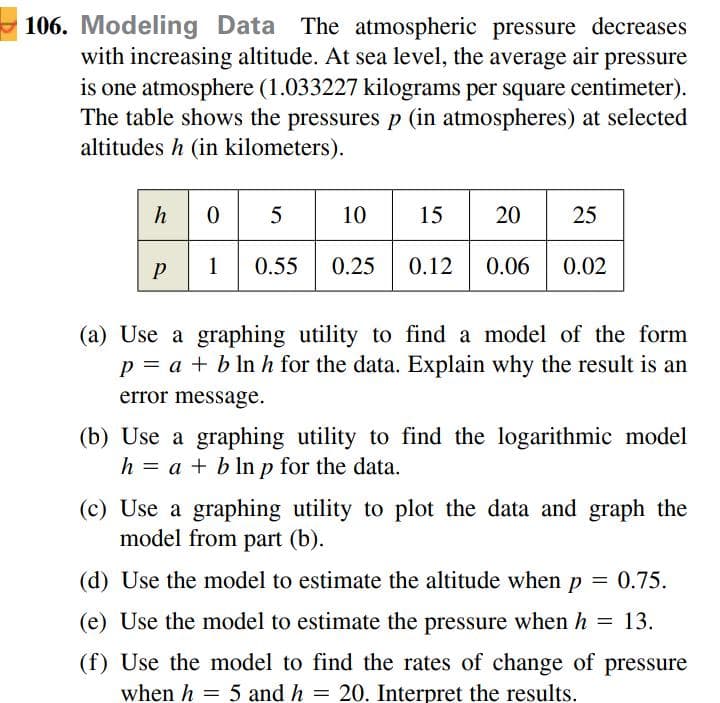
Modeling Data The atmospheric pressure decreases with increasing altitude. At sea level, the average air pressure is one atmosphere (1.033227 kilograms per square centimeter). The table shows the pressures p (in atmospheres) at selected altitudes h (in kilometers). h0 5 10 15 20 25 1 0.55 0.25 0.12 0.06 0.02 (a) Use a graphing utility to find a model of the form p = a + b ln h for the data. Explain why the result is an error message. (b) Use a graphing utility to find the logarithmic model h = a + b ln p for the data. (c) Use a graphing utility to plot the data and graph the model from part (b).
Modeling Data The atmospheric pressure decreases with increasing altitude. At sea level, the average air pressure is one atmosphere (1.033227 kilograms per square centimeter). The table shows the pressures p (in atmospheres) at selected altitudes h (in kilometers). h0 5 10 15 20 25 1 0.55 0.25 0.12 0.06 0.02 (a) Use a graphing utility to find a model of the form p = a + b ln h for the data. Explain why the result is an error message. (b) Use a graphing utility to find the logarithmic model h = a + b ln p for the data. (c) Use a graphing utility to plot the data and graph the model from part (b).

Functions and Change: A Modeling Approach to College Algebra (MindTap Course List)
6th Edition
ISBN:9781337111348
Author:Bruce Crauder, Benny Evans, Alan Noell
Publisher:Bruce Crauder, Benny Evans, Alan Noell
Chapter2: Graphical And Tabular Analysis
Section2.6: Optimization
Problem 11E: Maximum Sales Growth This is a continuation of Exercise 10. In this exercise, we determine how the...

Related questions

Topic Video
Question
need to know the procedure to find the value of a and b, of the function h = a+blnp, given in the picture attached
Transcribed Image Text:Modeling Data The atmospheric pressure decreases
with increasing altitude. At sea level, the average air pressure
is one atmosphere (1.033227 kilograms per square centimeter).
The table shows the pressures p (in atmospheres) at selected
altitudes h (in kilometers).
h0 5
10
15
20
25
1
0.55
0.25
0.12
0.06
0.02
(a) Use a graphing utility to find a model of the form
p = a + b ln h for the data. Explain why the result is an
error message.
(b) Use a graphing utility to find the logarithmic model
h = a + b ln p for the data.
(c) Use a graphing utility to plot the data and graph the
model from part (b).
Expert Solution
This question has been solved!
Explore an expertly crafted, step-by-step solution for a thorough understanding of key concepts.

This is a popular solution!

Trending now
This is a popular solution!

Step by step
Solved in 4 steps with 6 images

Knowledge Booster


Learn more about
Need a deep-dive on the concept behind this application? Look no further. Learn more about this topic, calculus and related others by exploring similar questions and additional content below.Recommended textbooks for you
Functions and Change: A Modeling Approach to Coll…
Algebra
ISBN:
9781337111348
Author:
Bruce Crauder, Benny Evans, Alan Noell
Publisher:
Cengage Learning

Algebra & Trigonometry with Analytic Geometry
Algebra
ISBN:
9781133382119
Author:
Swokowski
Publisher:
Cengage

Trigonometry (MindTap Course List)
Trigonometry
ISBN:
9781337278461
Author:
Ron Larson
Publisher:
Cengage Learning
Functions and Change: A Modeling Approach to Coll…
Algebra
ISBN:
9781337111348
Author:
Bruce Crauder, Benny Evans, Alan Noell
Publisher:
Cengage Learning
Algebra & Trigonometry with Analytic Geometry
Algebra
ISBN:
9781133382119
Author:
Swokowski
Publisher:
Cengage
Trigonometry (MindTap Course List)
Trigonometry
ISBN:
9781337278461
Author:
Ron Larson
Publisher:
Cengage Learning
