myopenmath.com 7- The graph of f(x) is shown in red. Draw the graph of g(x) = Make sure to start at one of the endpoints, not the middle point. After finishing the graph, click outside the grid to stop drawing. f(x). %3D -8 -7 -6 -5 -4-3 -2- -7 Clear All Draw: Polygon
myopenmath.com 7- The graph of f(x) is shown in red. Draw the graph of g(x) = Make sure to start at one of the endpoints, not the middle point. After finishing the graph, click outside the grid to stop drawing. f(x). %3D -8 -7 -6 -5 -4-3 -2- -7 Clear All Draw: Polygon

Chapter2: Equations And Inequalities
Section2.5: Quadratic Equations
Problem 53SE: Suppose that an equation is given p=2x2+280x1000 , where x represents the number of items sold at an...

Related questions
Question
100%
Transcribed Image Text:A myopenmath.com
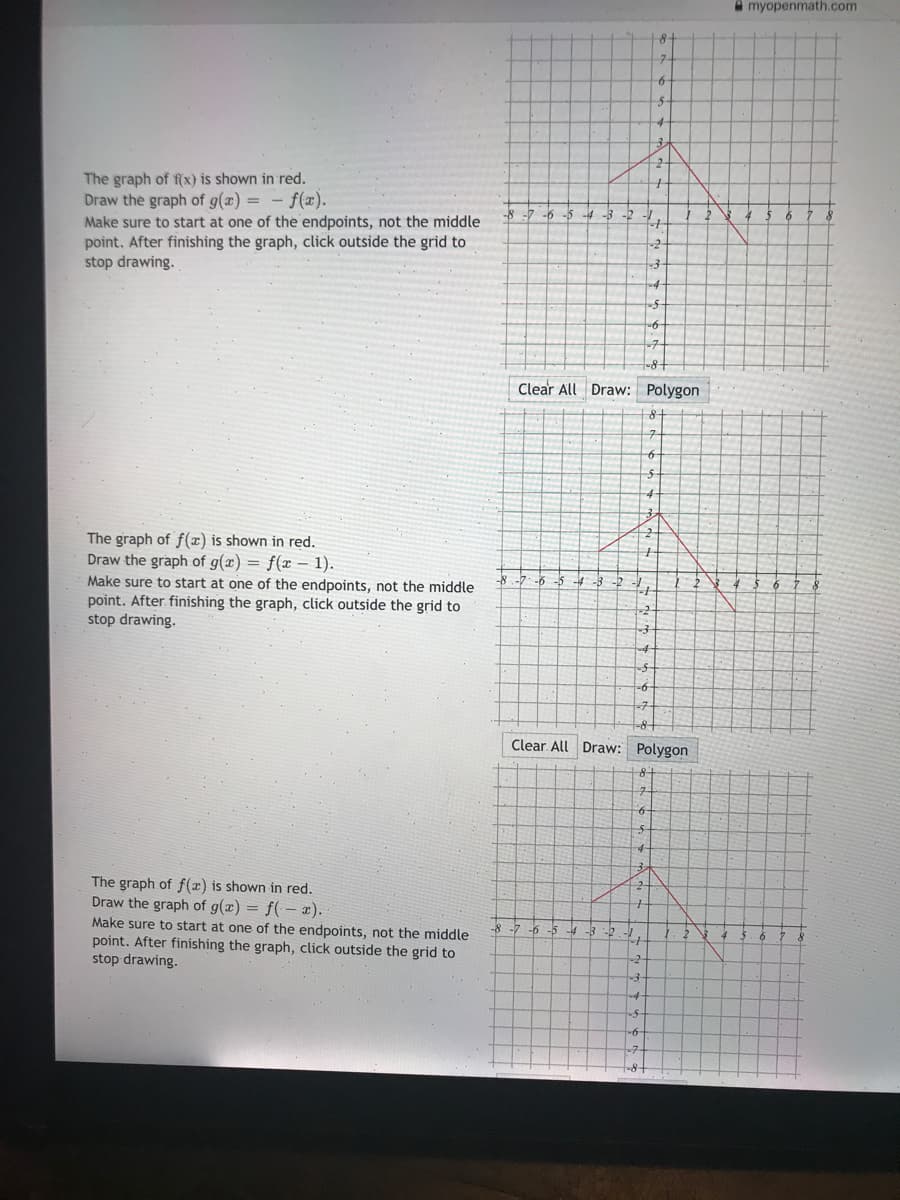
The graph of f(x) is shown in red.
Draw the graph of g(x) = - f(x).
-8 -7 -6
4 -3
Make sure to start at one of the endpoints, not the middle
point. After finishing the graph, click outside the grid to
stop drawing.
-2-
-6-
Clear All Draw: Polygon
The graph of f(x) is shown in red.
Draw the graph of g(x) = f(x - 1).
Make sure to start at one of the endpoints, not the middle
-7
-5 -4-3 -2
point. After finishing the graph, click outside the grid to
stop drawing.
Clear. All Draw: Polygon
The graph of f(x) is shown in red.
Draw the graph of g(x) = f(- x).
Make sure to start at one of the endpoints, not the middle
-8 -7 -6 -5
-3-2
point. After finishing the graph, click outside the grid to
stop drawing.
-2
Expert Solution
Step 1

Trending now
This is a popular solution!

Step by step
Solved in 2 steps with 2 images

Recommended textbooks for you

College Algebra
Algebra
ISBN:
9781305115545
Author:
James Stewart, Lothar Redlin, Saleem Watson
Publisher:
Cengage Learning

Glencoe Algebra 1, Student Edition, 9780079039897…
Algebra
ISBN:
9780079039897
Author:
Carter
Publisher:
McGraw Hill
College Algebra
Algebra
ISBN:
9781305115545
Author:
James Stewart, Lothar Redlin, Saleem Watson
Publisher:
Cengage Learning
Glencoe Algebra 1, Student Edition, 9780079039897…
Algebra
ISBN:
9780079039897
Author:
Carter
Publisher:
McGraw Hill

Functions and Change: A Modeling Approach to Coll…
Algebra
ISBN:
9781337111348
Author:
Bruce Crauder, Benny Evans, Alan Noell
Publisher:
Cengage Learning

Algebra & Trigonometry with Analytic Geometry
Algebra
ISBN:
9781133382119
Author:
Swokowski
Publisher:
Cengage

Trigonometry (MindTap Course List)
Trigonometry
ISBN:
9781337278461
Author:
Ron Larson
Publisher:
Cengage Learning